
Setting The Stage
Around the holidays of 2020 it was a bit quieter, and I decided it might be a great time to go investigate how the Visual Studio profiling tools worked. I have been a long-time user of the Windows Performance Analyzer (WPA), which is a great tool for doing systems-level performance analysis. It is, however, quite complex and difficult to learn, and I’d heard that the Visual Studio Profiler had improved a lot since I last looked at it.
I could have chosen a toy program to look at, but it felt like I’d learn more by approaching a real codebase of significant size. The Windows Terminal project was a great one because it is a sizeable C++ codebase with plenty of history and legacy. If I could find anything cool to optimize, it would give me a chance to contribute back as it’s open source. As a bonus, I happened to know from some internal conversations that conhost.exe is launched over 1 billion times a day, so if I found any optimizations they might have a measurable impact on CPU cycles spent across the globe.
Cloning and getting the first trace
I began by forking and cloning the Windows Terminal repo. If you’d like to follow along at home and repeat my steps, you can also clone that repo to the commit I had at the time, 551cc9a9. I followed the Windows Terminal repo readme to ensure I had all the right dependencies set up, then opened OpenConsole.sln in Visual Studio 2019.
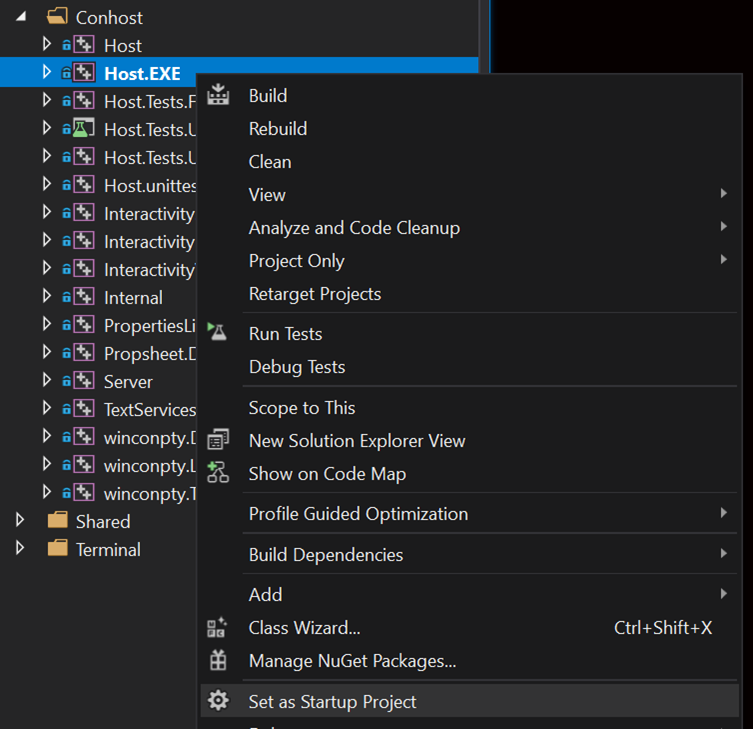
Once in Visual Studio, I switched the Solution Configuration to Release since performance investigations should almost always be done on Release builds to see the full effects of any optimizations the toolchain will perform. Then I switched the Solution Platform to x64 since I have a 64-bit machine and figure most people do too by now. Lastly, I changed the Startup Project to Host.EXE which is where OpenConsole.exe builds – this is the open source version of conhost.exe that I wanted to look at.
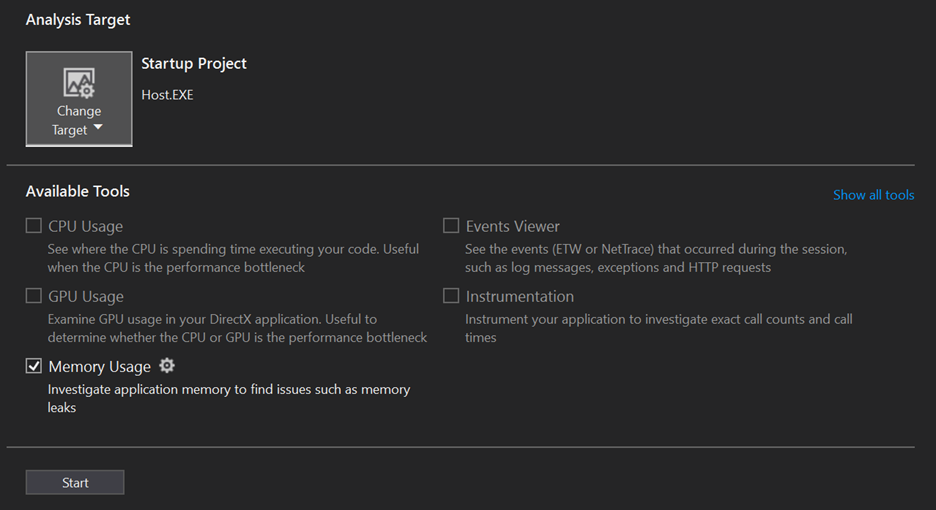
I built the solution then launched the Visual Studio Profiler. You can go to Debug > Performance Profiler, but I like to launch it with Alt+F2 as a shortcut. The profiler then prompts you to choose what you want to investigate: CPU, GPU, memory, etc.
I decided I wanted to look at memory since I have some experience in that area. Memory allocations can have significant CPU costs because the heap must do work to maintain a list of freed allocations, buckets, and various other heap-y details. Usually reducing allocations will noticeably impact CPU time, so it’s a cool way to improve memory and CPU at the same time. I checked the Memory Usage option and clicked Start.
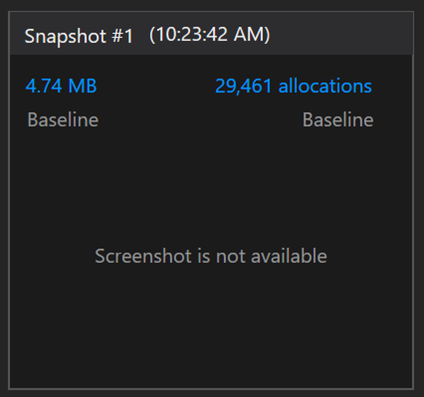
At that point the console app starts up, and I can see a command-line with a blinking cursor as expected. In Visual Studio, I’m offered the option to take a memory snapshot:

I click this button to snapshot memory that has been allocated up until now in the startup process then click Stop Collection to finish this profiling session and close the app. Note that the first time you do this Visual Studio may process things for several minutes as symbols get loaded and things index, but it’s much faster on future iterations – so be patient the first time. The time to do this has been substantially improved in Visual Studio 2022 as well.
The exact results you see may vary by machine. On my machine I saw this:
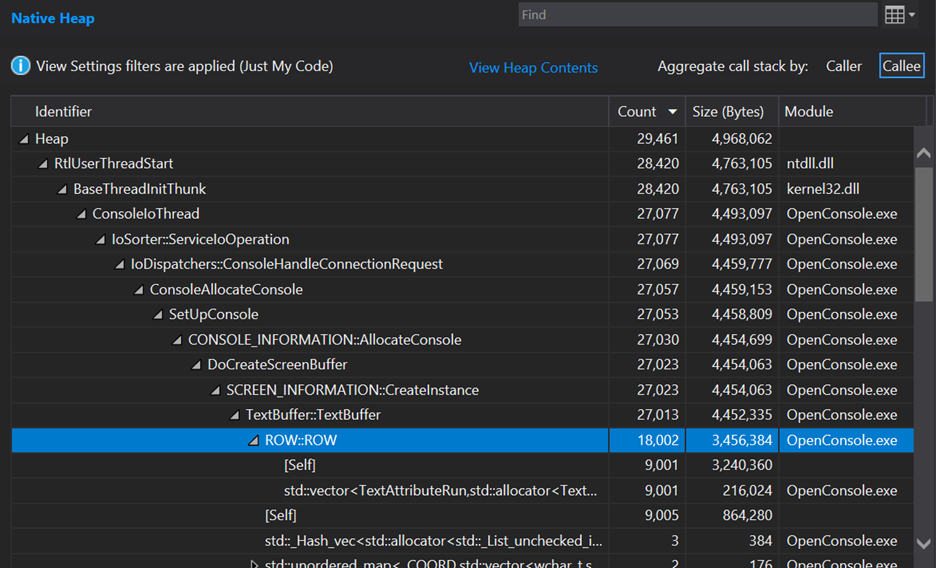
I clicked on the link for “29,461 allocations” and saw this:
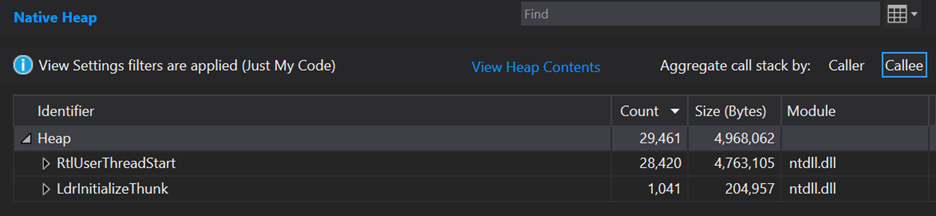
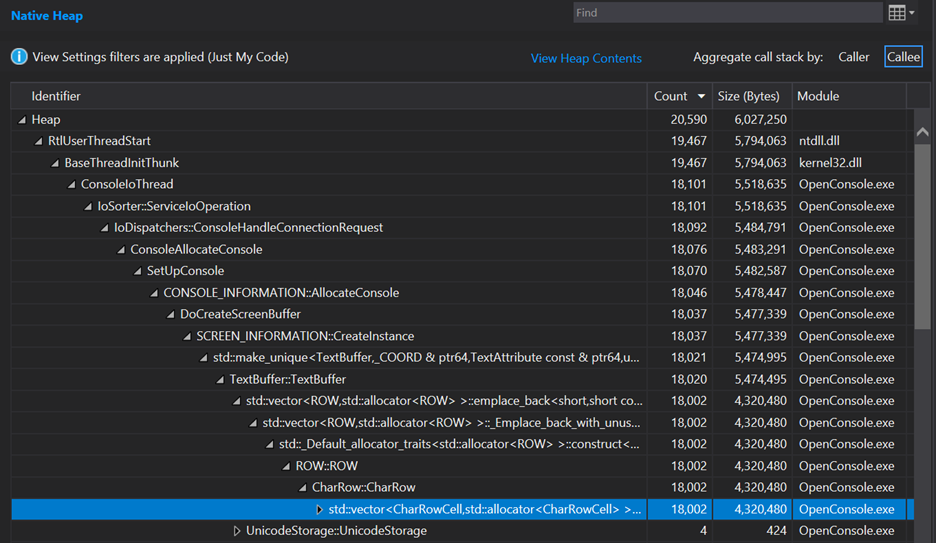
That view is not very useful yet, but we can expand the callstack to look for where these come from in our code. Expanding out several nodes in RtlUserThreadStart where the vast majority of the allocations are to look for something interesting, I see this:
Discovering a suspicious allocation
What this shows is that we start off with 29,461 total allocations in this trace. 27,077 of these allocations belong to the ConsoleIoThread function and the things it calls. Digging in we can see that 18,002 of these come from ROW::ROW. Wow, that seems like a large percentage of the total allocations! This is basically a leaf node in the allocation callstack and starting at a leaf node is nice because it should be the thing directly doing the memory allocation, so I’ll start there.
It seems like a lot of these ROW objects are being allocated, but why? At this point, I started reading a little code near this callstack and found this loop in TextBuffer constructor:
// initialize ROWs
for (size_t i = 0; i < static_cast<size_t>(screenBufferSize.Y); ++i)
{
    _storage.emplace_back(static_cast<SHORT>(i), screenBufferSize.X, _currentAttributes, this);
}
The next question is: what is the value of screenBufferSize.Y? Debugging through this code will reveal that it is, in fact, 9001 – but where does that come from? It’s from Settings::ApplyDesktopSpecificDefaults, where _dwScreenBufferSize.Y = 9001, which happens very early in startup and gets used as the default number of rows in the console.
Ok, cool – so for some reason or other (likely compatibility) the default number of rows of text in the buffer is 9001 – but why do we need to allocate 9001 times to do this? Shouldn’t we be able to just do one allocation of an array of 9001 of these ROW objects?
Looking at TextBuffer.hpp, the ROW objects are stored in a std::deque:
std::deque<ROW> _storage;
A std::deque will allocate every time an element is inserted into it. By contrast, a std::vector internally maintains an array. So in this case when we initially set up the TextBuffer::_storage, we insert 9,001 ROW objects into it. This results in the ROW constructor running 9,001 times as well as 9,001 allocations inside of the std::deque.
This should be an easy fix, right? Can we just swap it out for a std::vector? Let’s do that. I changed _storage to be a std::vector and added #include <vector> at the top of the file to see where I get.
The simple fixes usually require a little iteration
Of course, it’s not that simple, as I hit some issues with test code. Usually while hacking around and trying to understand something, I find it helpful to unload the tests from the solution to improve build iteration times until something is promising enough to run functional tests on. Performance investigations can have many dead-ends and waiting to run and fix up tests for any changes to data structures can be put off until later. So, for the purposes of this case study, I unloaded all the test projects to improve iteration times – but of course before the final PR was submitted I ran and fixed all the tests.
With tests unloaded, it’s still not quite as easy as changing a std::deque to a std::vector – this code was using deque as a circular buffer so it’s using pop_front() which vector does not have. For now, let’s ignore that and hack away just to get some numbers.
Let’s turn this loop in TextBuffer::ResizeTraditional:
while (&newTopRow != &_storage.front())
{
    _storage.push_back(std::move(_storage.front()));
    _storage.pop_front();
}
Into this loop:
for (int i = 0; i < TopRowIndex; i++)
{
    _storage.emplace_back(std::move(_storage.front()));
    _storage.erase(_storage.begin());
}
Ok, now everything builds again, and I can re-run numbers to see if this had the expected effect of reducing allocations.
Small victories can have big impacts
On my machine just that one change of a deque to a vector, I see this:
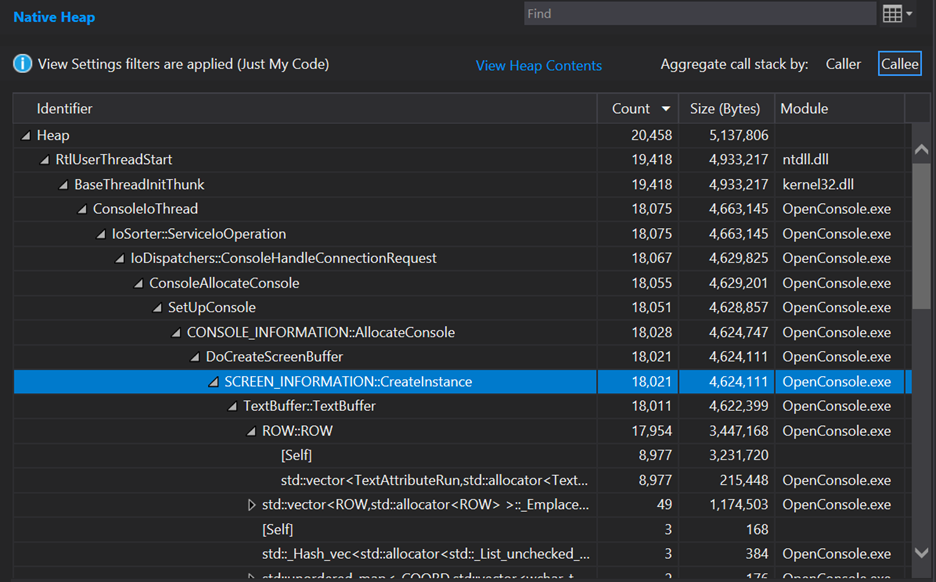
Good news! This reduced the allocation count total during startup from 29,461 -> 20,458 (by 9,003!). Wow, this reduced the allocations in the startup path by just over 30% from this small change. How cool! This is what gets me so excited about doing performance work – when it works, the numbers are so compelling and measurable.
Still, I think I can do better. std::vector will start out with some amount of elements in it, then when you push_back beyond its capacity it will re-allocate and copy all elements over into a buffer twice as large. So initially we’ll start out with a small array and end up re-allocating it multiple times as it starts up to finish fitting all 9,001 of these. After this is completed, we’ll also have an improperly sized buffer with some “waste” on the end.
We can fix this simply by telling the vector to reserve the right amount of elements before inserting all of the ROW objects. In the TextBuffer constructor, add this as the first line:
_storage.reserve(static_cast<size_t>(screenBufferSize.Y));
Re-running the trace on my machine shows this:
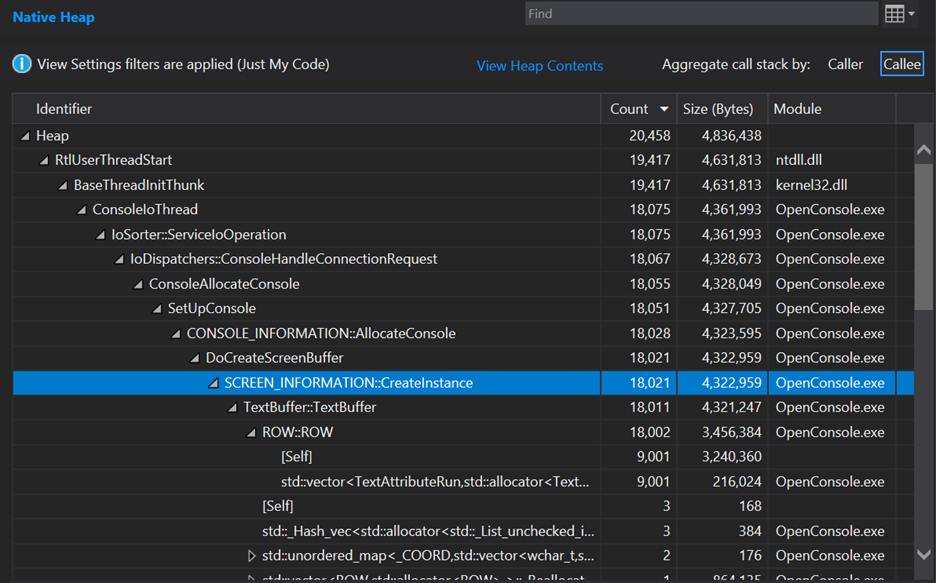
I don’t understand why the allocation count didn’t reduce. This should have seen a few allocations reduce since all 9,001 ROW objects get reserved right away. But at least it right-sized the allocation and we see a drop in total memory consumption of about 300 KB so now there’s no regression in total memory consumption – in fact it reduced total memory consumption from the starting point by a little bit.
So far so good! Can we do even better than this? Yes, I think we can. Each of those ROW instances shows it is allocating in a std::vector<TextAttributeRun>, but this is a bit misleading as the ROW doesn’t have any std::vector<TextAttributeRun> members. Each ROW instance owns an ATTR_ROW and that is what actually owns the std::vector<TextAttributeRun>. The reason it shows up this way in the profiler UI is because the ATTR_ROW constructor is so small it gets inlined into ROW::ROW – this is a thing to watch out for in optimized code, sometimes inlining gets callstacks to be a bit confusing.
If you were to look at this in memory (which a tool like SizeBench can help you do), each instance of ROW is laid out like this:
ROW structure in memory
| Offset | Member | Member Size in Bytes |
| 0 | CharRow _charRow | 40 |
| +40 | ATTR_ROW _attrRow | 32 |
| +72 | short _id | 2 |
| +74 | <alignment padding> | 6 |
| +80 | int64 _rowWidth | 8 |
| +88 | TextBuffer* _pParent | 8 |
That ATTR_ROW member takes up 32 bytes. Let’s expand that in memory too and it looks like this:
ATTR_ROW structure in memory
| Offset | Member | Member Size in Bytes |
| 0 | std::vector<TextAttributeRun> _list | 24 |
| +24 | int64 _cchRowWidth | 8 |
Ah, but that _list member, now that’s interesting – that vector is only 24 bytes because internally a vector is storing a pointer off to the allocated array of data it contains. So that vector might be one element long or 1000 elements long, and it’ll remain 24 bytes in the ATTR_ROW. That’s unfortunate in our case because most rows of a console have a single TextAttributeRun yet we pay to allocate the array elsewhere in memory and then indirectly access via that pointer when we want to get to the elements.
Paying attention to common patterns and practices
There are many codebases that run into situations like this and want a vector that can store some number of elements inside of itself and only go out to the heap when they spill over that default amount. This is such a common pattern that the STL even has it implemented for a very important type – std::basic_string, the underlying type behind std::string and std::wstring. This so-called “small string optimization” keeps strings up to a certain size directly in the std::[w]string without allocating from the heap, only reaching out to the heap for larger strings. Unfortunately std::vector has no such optimization, but a number of variations of it exist in many codebases.
For Windows Terminal, I decided to use the implementation in boost called boost::container::small_vector. With a small_vector, you can specify the type for it to hold (just like std::vector), and you also specify how many elements it should reserve space for. Because I know most ROW objects have just a single TextAttributeRun, I replaced this line in AttrRow.hpp:
std::vector<TextAttributeRun> _list;
With this line:
boost::container::small_vector<TextAttributeRun, 1> _list;
After adjusting some build files to allow the right boost header to be located, I began to hit problems with small_vector not being exactly the same as vector. Instead of calling push_back, I needed to call emplace_back in a few places and this was a good time to sprinkle in a bit of noexcept because small_vector makes more guarantees about when it can and cannot throw compared to vector. All the changes in AttrRow.cpp, AttrRow.hpp, AttrRowIterator.cpp and AttrRowIterator.hpp can be seen in the Pull Request for the full change.
Re-building and re-running the trace from there shows these results:
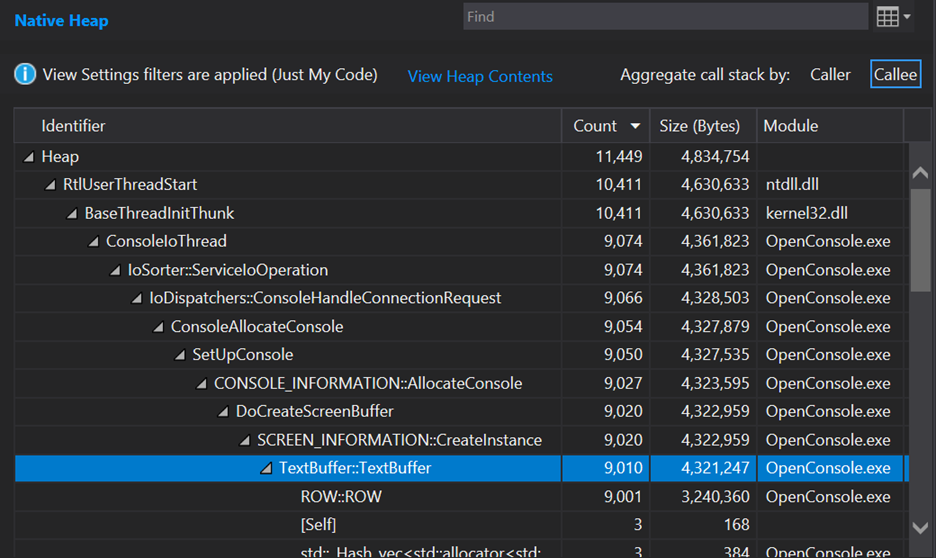
Nice – another 9,001 allocations knocked out. Now the memory layout of each ROW looks like this:
ROW structure in memory after using small_vector
| Offset | Member | Member Size in Bytes |
| 0 | CharRow _charRow | 40 |
| +40 | ATTR_ROW _attrRow | 56 |
| +96 | short _id | 2 |
| +98 | <alignment padding> | 6 |
| +104 | int64 _rowWidth | 8 |
| +112 | TextBuffer* _pParent | 8 |
That ATTR_ROW member now takes up 56 bytes – so what’s it doing with that extra space? Let’s expand that in memory too and it looks like this:
ATTR_ROW structure in memory after using small_vector
| Offset | Member | Member Size in Bytes |
| 0 | small_vector<TextAttributeRun, 1> _list | 48 |
| +48 | int64 _cchRowWidth | 8 |
So, isn’t this worse, since things are bigger? Nope. As seen in the callstack screenshots, the total memory usage of the app during startup went from 4,836,438 to 4,834,754 – it actually went down just a bit. Why’s that? Because now these small_vector instances contain space to store a single TextAttributeRun internally without needing to allocate – this saves us an allocation (and thus CPU time spent in the heap) while also saving a bit of memory by not needing the vector’s internal pointer and the array it pointed to.
If a specific ATTR_ROW instance needs space for more than one TextAttributeRun at runtime, that’s no problem – it will just allocate at that time. For the common case of a single run, this will keep memory constrained and also speed up startup when the buffer is filled with single run ROW objects.
Optimization confusion in callstacks and when to profile in Debug configuration
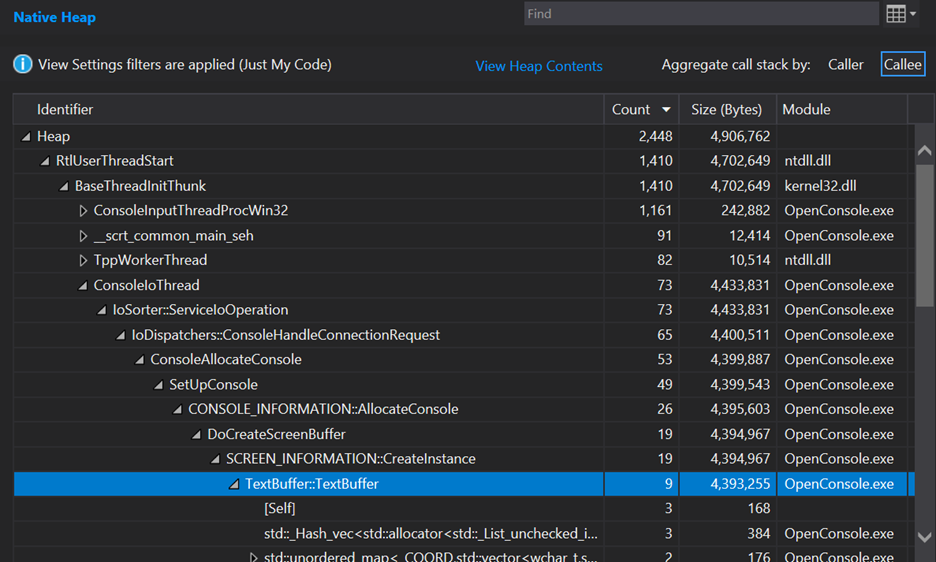
Next up: what are the other 9,001 allocations in the ROW constructor? I puzzled about that for a while unsure of what it could be. Due to inlining, I couldn’t see what was causing it. Therefore, it was a good time to switch into Debug mode and build and run the trace there in hopes it would show a callstack easier to follow. Doing that shows this:
The exact allocation counts and amount of memory differ substantially here, and this is normal in many codebases. This codebase may have extra debug information stored that is not present in Release builds or things like that. What’s interesting is to see the deeper callstack of things like std::make_unique<TextBuffer...> that were not present in the Release trace, because that call was completely inlined in a Release build. Likewise, we can now see that the constructor for ROW is calling the constructor of CharRow which is where there is yet another std::vector – this time holding CharRowCell instances, and this is the source of our other mysterious 9,001 allocations.
Rinse and repeat
With that discovered, it looked like we could use the same playbook as before and see if std::vector could be replaced with a small_vector. I switched back to Release builds to have comparable numbers with the earlier traces now that I know where to focus attention. Looking at CharRow and that vector of CharRowCell suggests another opportunity to change to a boost::container::small_vector to place the initial storage into the CharRow instance, thus avoiding another allocation per row. So, I changed the _data member from this:
std::vector<value_type> _data;
To this:
boost::container::small_vector<value_type, 120> _data;
How did I know to pre-size it to 120? Once again, with some debugging this comes back to that same function we saw earlier, Settings::ApplyDesktopSpecificDefaults. It sets the default screen width in a variable called _dwScreenBufferSize.X to 120, which eventually flows through to the constructors of each ROW and then to each CharRow. So, by pre-sizing this to 120 elements it avoids allocating for any CharRow‘s initial storage of CharRowCell objects.
This again requires a few fixups throughout CharRowCell.hpp and CharRowCell.cpp, which you can see in detail in the Pull Request for the full change. Once those changes are made, let’s see what this data structure change did to the trace. As a reminder, this is now back in Release mode so I’ll compare numbers to the last run we did in Release mode (not the previous one showing Debug that helped navigate the callstack):
Wow! Another large reduction of allocations. So much so that the entire ConsoleIoThread isn’t even at the top of allocations under BaseThreadInitThunk anymore. The total allocations have now dropped to 2,448, meaning we’ve reduced allocations by almost 92% from where they started (29,461 to 2,448). Total memory consumption has gone from 4,968,062 to 4,906,762, a much more modest reduction of 1.2% but still a reduction. So basically, this is changing the layout of memory to not need as many calls to the heap to be arranged without affecting total memory consumption.
At this point it looks like the allocation reduction well is drying up, so this case study will stop here. The final Pull Request included a few other small changes that helped with memory usage and CPU usage a bit, but those are outside the scope of this case study.
To ask the right question is already half the solution of a problem
I was not familiar with the Windows Terminal codebase when approaching this and was very pleasantly surprised to see how quickly the Visual Studio Profiling tools helped me find interesting questions to ask and interesting code to dig into. It can be easy to get lost in large swaths of code, but great tools like this help to focus attention on things that really matter, and we can see that just a few relatively tactical changes to a large codebase can result in substantial savings. Even in code that is decades old, there’s bound to be something cool to find!
If this were a cheesy 80s cartoon ending, I would say “Now you know, and knowing is half the battle!” and we’d all chuckle as the outro music played 😁
But seriously, I want to extend my thanks to the Windows Terminal team for asking good questions during the Pull Request process and helping shepherd my change in to ultimately being accepted. You can see the results of this change in Windows Terminal 1.6 and later, and the changes also flowed back into the Windows 11 version of conhost.exe.
Hopefully this provides some ideas on strategies for reducing memory allocations in your codebase and shows how to use the very nice Visual Studio memory profiling tools to zero in on interesting problems.
Happy Profiling,
Austin
If you give this tool a try and have any feedback for us, please fill out this survey, we’d love to hear from you.
Is there a hidden game of “spot the rotate” here?
default width on my machines is set to 160 characters wtf