Have you ever wondered what’s happening under the hood of your .NET application? Do you want to quickly and easily identify and fix performance bottlenecks? If so, Visual Studio has the perfect tool for you: the profiler.
The profiler allows you to analyze your code’s performance, pinpoint hot paths, detect memory leaks, address thread contention, and more. It helps you measure CPU usage, memory consumption, and file activity, and lets you drill down into specific methods and lines of code.
But what if the code you need to profile isn’t yours? What if it’s a third-party library, a NuGet package, or a framework component without source code access? How can you uncover what’s happening inside those black boxes?
That’s where the new auto-decompilation feature comes in handy.

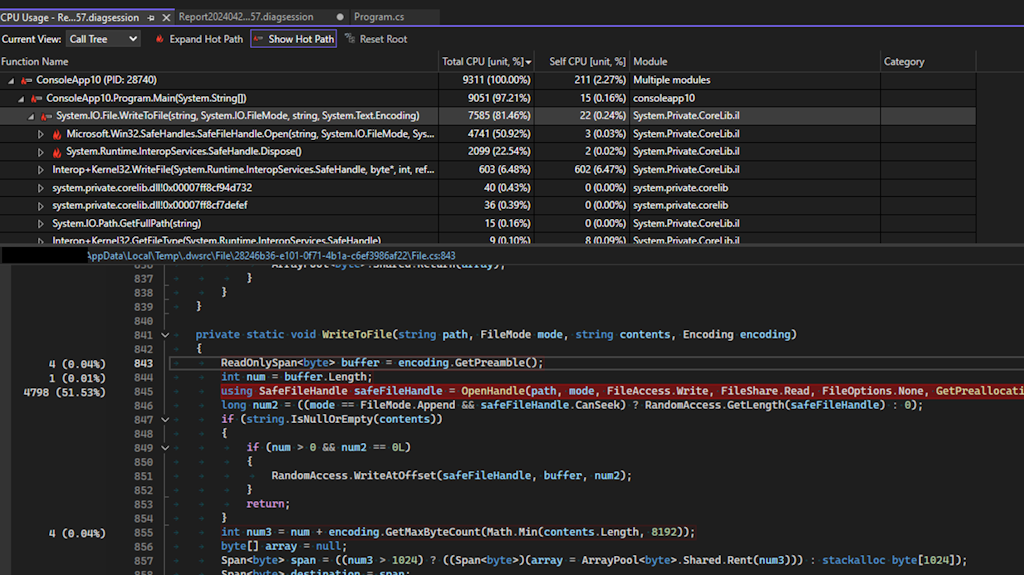
With Visual Studio 2022, the profiler can automatically decompile the .NET code that you don’t have the source code for and show you the decompiled C# or Visual Basic code in the source view. This way, you can gain insights into the code’s structure and performance issues, even without loaded symbols or exact file locations.
This feature is particularly helpful when dealing with non-user external code, empowering you to analyze and optimize your application’s performance effectively, thus enhancing your development workflow.
How to Use Auto-Decompilation in Visual Studio Profiler
To use this feature, make sure Automatically decompile code during source lookup in the Tools > Options > Debugging > General settings is enabled. Then, you can launch the profiler from the Debug > Performance Profiler menu, or by pressing Alt+F2.
Once the profiler is running, you can select the type of analysis you want to perform, such as CPU Sampling, Memory Usage, or .NET Object Allocation Tracking. The profiler will collect the data and display it in various views, such as Call Tree, Functions, Modules, or Caller/Callee. You can also use filters, search, and grouping options to narrow down the results.

To view the source code of a function, simply double-click on it in any of the views, or right-click and select “Go To Source.” If the source code is available, the profiler will open it in the editor. If not, the profiler will attempt to decompile the code and display it in a read-only window. This allows you to inspect the code, view line numbers, and navigate to the callers and callees.
Additionally, you can compare snapshots of the same function taken at different times to see how the code has changed. This helps you identify performance regressions or improvements and understand the impact of your code changes.
Keep in mind that decompiled code may not be identical to the original, as some information can be lost during compilation. However, the decompiled code should be close enough to provide a good understanding of what the code does and how it impacts your app’s performance
We Want to Hear from You
We hope you find this feature useful in improving the performance of your .NET applications. We are committed to enhancing Visual Studio and greatly value your feedback. Please share your thoughts on this feature and any suggestions or issues by using the Help > Send Feedback > Report a Problem or Provide a Suggestion options in Visual Studio, or by leaving a comment below. Thank you for your continuous support!
Stay connected with the Visual Studio team by following us on Twitter @VS_Debugger, Twitter @VisualStudio, YouTube, and LinkedIn.


0 comments