
When managing servers, it’s important to ensure that they are running as efficiently as possible while meeting the performance needs of their workloads. Windows Server offers several features you can use to tune servers for more efficient power use. This article gives an overview of the key features and how to enable them, as well as touch on collecting traces and running benchmarks to see what’s impacted by these features. The goal of this guide is to help you find the right sets of power configurations to be able to meet the demands of your workload while being energy efficient.
Performance States
Overview
There are two characteristics which describe processor performance: frequency and voltage. As CPU frequency increases, the voltage required also increases. However, this is not a linear relationship, there are certain frequencies which are the most energy efficient. The goal is to run time critical workloads with high performance and consequently , and run other workloads at an energy efficient frequency with less performance. Here’s an illustration which shows finding the right balance between power and performance, and why running at maximum CPU frequency isn’t required all the time.
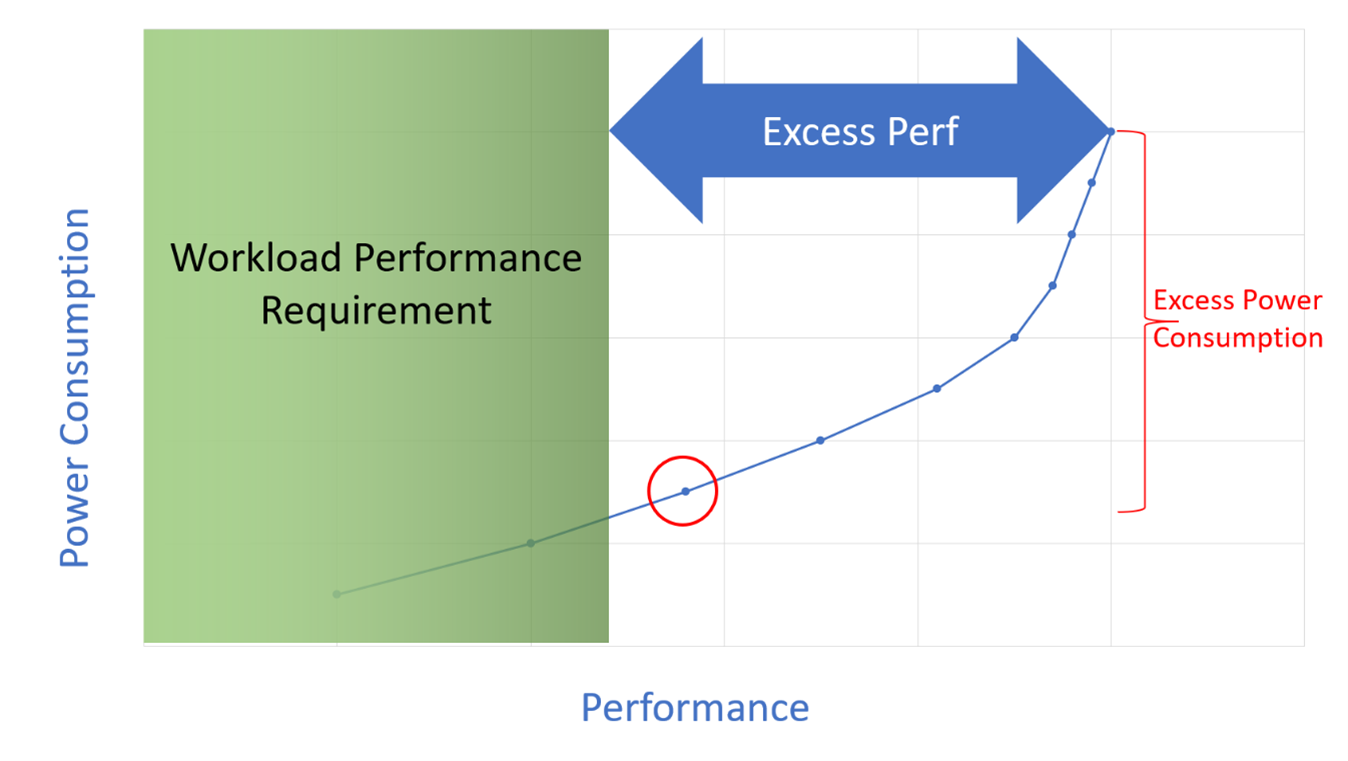
Each point on the graph describes a frequency point that the processor supports. The one that is circled is the optimal choice in this case, such that it provides enough performance for what is required by the workload (this can be measured using benchmarks and comparing this to customer requirements) and consumes the least amount of power to do so.
There are that can help achieve this goal.
Performance-States (P-States)
P-States uses a list of all the frequency points the processor is able to support. Starting at P0, which is maximum performance with the highest frequency excluding turbo, each additional step brings the frequency down to the next available frequency on the list (P1, P2, etc.). The OS uses CPU utilization and a target range for utilization to determine the P-State, speeding up the processor when utilization is high and vice versa.
Collaborative Processor Performance Control (CPPC)
With CPPC the processor uses a set of parameters to limit its behavior within the desired range, such as max and min frequency. which uses this set of parameters to make prioritization and tradeoff decisions to set cores to their optimal frequency based on the workloads that are running. When making the decision for what frequencies to run at, the hardware takes information and suggested values from the OS to align that decision with the OS and user.
Idle States
Overview
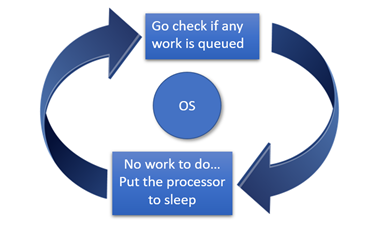
Occasionally, there are brief periods of time (measured in milliseconds) when there is no pending work for the processor to do. In these situations, the operating system can attempt to reduce power (and capabilities) until new work arrives. In the second case the processor is able to turn off parts of itself in order to save power, this is referred to as the idle state.
There are many stages of idle states, the deeper the idle state the more hardware is turned off and therefore less power is consumed. However, there is a latency and power cost to waking up a processor once it’s in an idle state, both increases as the idle state gets deeper. This means that going into the deepest idle state is not the best course of action every time a processor is idle, as some workloads have a latency requirement when it first begins or the total energy savings could be a net loss due to the cost from waking from a deep state. The goal is to put a processor into a deep idle state when it’s estimated to not receive any work for a long period of time, or be put into a shallow idle state otherwise. This is where C-States and LPI States come in.
C-States
Talking about C-States could get a little bit confusing since there are three different kinds of C-States.
There’s core C-State, the hardware idle state responsible for idling individual cores and turning components within the cores off to save power.
Then there is processor C-State, or package C-State, which is responsible for managing the shared resources between cores such as the L2 cache or clock generators. These resources have opportunities to be shut off to conserve power when all the cores that rely on these resources are in idle states.
Lastly we have logical C-State. This is the OS’s view of processor C-States, which manages the idle states of logical cores that map to physical cores. The OS C-State ranges from C0 to C3, where C0 is the operational state and the CPU is executing instructions, and C3 being the deepest idle state. Deeper C-states may be present, but are abstracted from the operating system as just C3. The logical C-State is the one we’ll be focusing on in this document for enablement and tuning.
LPI States
LPI is a superset function of C-State, adding additional capabilities to what’s already been provided by C-State. The LPI capabilities are focused on providing hints to improve idle state selection, such as how long must the processor be in each idle state to be beneficial, cost of entering and exiting the idle state, and prediction of when the processor will be woken up again. LPI also provides the necessary information for platform states enablement due to the coordination required between cores to enter platform states. Platform states are a step further from core idle states, as not only the cores are going idle to save power, but the shared resources among them as well, such as caches. LPI offers compared to C-State, however it is not currently supported by the Hypervisor when serving VMs to customers, which only understands C-States when making idle state decisions.
Core Parking
Overview
Core parking is the result of the processor power management (PPM) engine and the OS thread-scheduler working dynamically to adjust the number of available cores to run threads. The goal is to maximize the benefits from performance and idle states by assigning work to the most optimal core available. Cores that are parked will not have any threads scheduled and will be able to enter idle states.
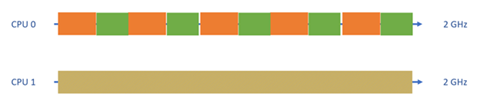
A simple example is shown below:

Here the two threads depend on each other to complete the previous phase to be able to start the next phase.
Below is the same scenario but with core parking enabled. The concurrency of the workload is detected, CPU 0 takes on the entire workload. Now instead of both cores briefly entering shallow idle states in short intervals, CPU 1 is able to enter a deep idle state for a long period of time, resulting in an energy net gain without loss of performance.
Core parking uses past workload data, such as utilization and concurrency, to predict future behavior, which is used to park or unpark cores.
Enablement
Powercfg.exe
Powercfg is a tool that lets us control power schemes, as well as analyze the system for common energy-efficiency and battery-life problems. It will also enable us to turn on all the features that’s been covered previously and tune various parameters that control how these features will behave. Powercfg can be accessed through command prompt (cmd.exe), it uses the following syntex: powercfg /option [arguments] [/?].
Here’s a list of useful options:
/? – Displays information about command line parameters.
/list, /L – Lists all power schemes.
/query, /Q – Displays the contents of a power scheme.
/change, /X – Modifies a setting value in the current power scheme.
/setactive, /S – Immediately sets the system to use the new values for parameters that have been modified.
/getactivescheme – Retrieves the currently active power scheme.
Performance States
It’s important to determine which interface the system is using. This information can be found in the system event logs, or through tracing (more detail on tracing below). Depending on which interface is used, different parameters are used to tune the performance states.

Performance states are enabled when PROCTHROTTLEMIN (Minimum Processor State) and PROCTHROTTLEMAX (Maximum Processor State) are set to different values. If both are set to 100%, then the processor is locked to run as fast as possible and will not take advantage of the power saving opportunities provided by performance states.
Idle States
Idle states are enabled through IDLEDISABLE (Processor Idle Disable). When it’s set to 000, idle states are enabled and when set to 001, idle states are disabled.
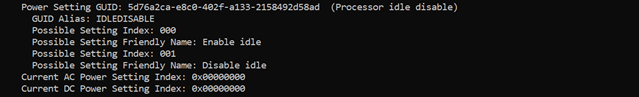
Another parameter to take note of is IDLESTATEMAX (Processor Idle State Maximum). This determines what idle states are allowed, ranging from shallow (1) to deepest idle states are allowed (14). A value of 0 means that no limit is imposed on how deep
Core Parking
Core parking can be enabled through CPMAXCORES (Processor Performance Core Parking Max Cores). This parameter specifies the maximum percentage of logical processors that can be in the unparked state at any given time. This means when set to 100%, core parking is disabled since no cores can be parked. The increment is based on the number of logical cores, so to enable core parking the percentage must be set so that at least a single core is able to be parked.

4 Core System Example:
Set to 100% – Core parking disabled.
Set to 75% – 1 core can be parked.
Set to 50% – 2 cores can be parked.
Set to 25% – 3 cores can be parked.
Set to 0% – All cores can be parked.
Configuring Settings
There are four values needed to make changes to a specific power setting: scheme_GUID, sub_GUID, setting_GUID and setting_index.
scheme_GUID – Specifies a power scheme GUID. This can be found by running powercfg /list.
sub_GUID – Specifies a power setting subgroup GUID. This can be found by running powercfg /query.
setting_GUID – Specifies a power setting GUID. This can be found by running powercfg /query.
setting_index – Specifies the value that the power setting is being set to. The list of possible values can be found by running powercfg /query.
The command used is /setacvalueindex, as this sets the value associated with a specified power setting while the computer is powered by AC power.
Powercfg /setacvalueindex <scheme_GUID> <sub_GUID> <setting_GUID> <setting_index>
Tracing
Tracing is an invaluable tool for evaluating how the configurations on the system are performing, debugging any issues that might have come up, and searching for further improvements. Traces can be taken with Windows Performance Recorder (WPR).
Information on using and downloading this tool can be found here: Windows Performance Recorder | Microsoft Docs.
One way to access the tool is through command prompt, to start the trace enter the command wpr -start power -filemode. To stop, enter the command wpr -stop filename.etl.
These traces then can be analyzed through Windows Performance Analyzer (WPA), which can be found and downloaded from the Microsoft Store for free: Get Windows Performance Analyzer – Microsoft Store.
Below are some graphs to be considered for each of the features covered in this document.
Performance States
Processor Performance
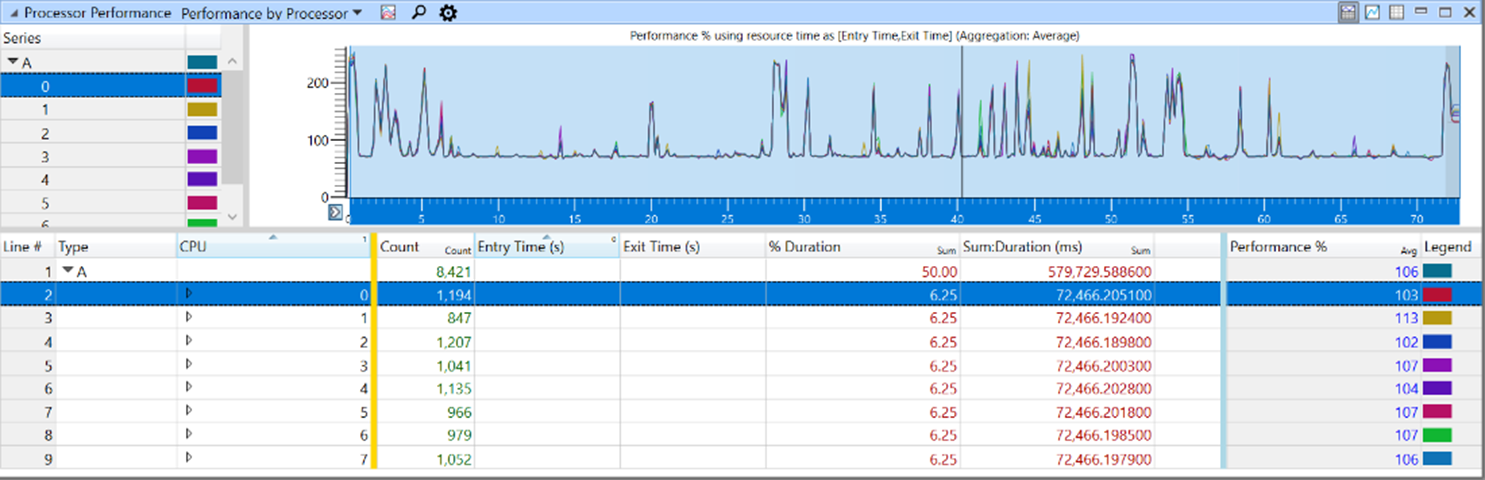
The Processor Performance graph shows what performance level the processor is running at which time, this is determined by CPU utilization, which is shown on the Processor Utilization graph. The Performance % column shows the % of normalized frequency (P0).
Other interesting graphs: Processor Performance Tuning, Processor Frequency
Idle States
CPU Idle States
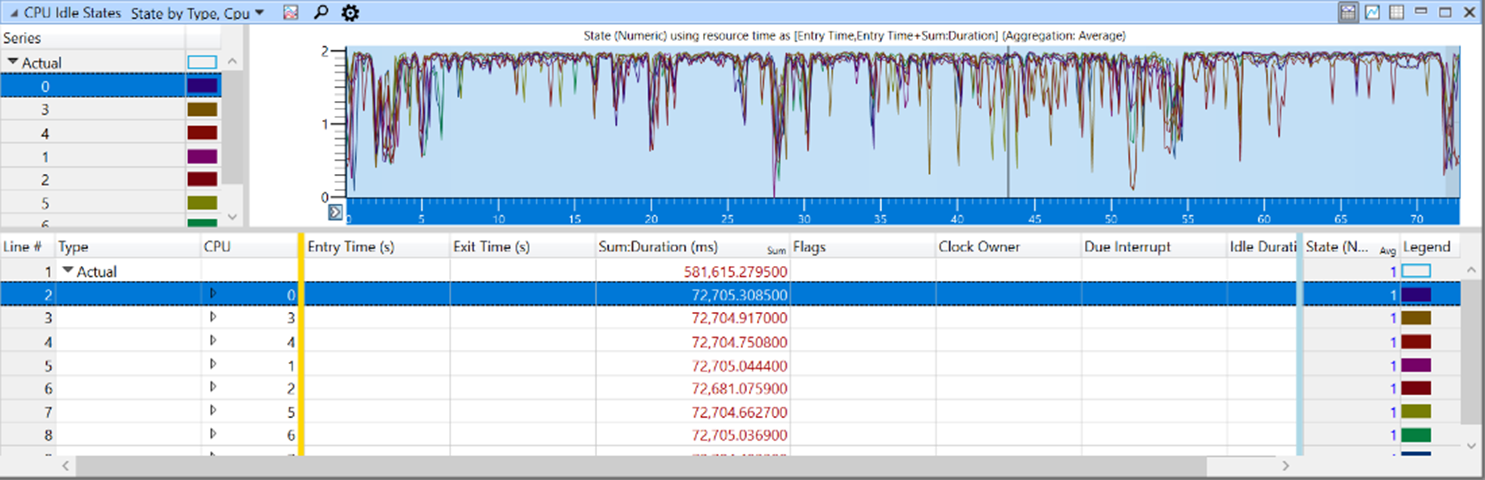
The CPU Idle States graph shows for each core whether or not they are in an idle state, if so which idle state, and the duration of time the core spent in that state.
Other interesting graphs: Platform Idle State, Coordinated Idle State
Core Parking
Processor Parking State

The Processor Parking State graph shows when cores are in a parked or unparked state and the duration that they are in the state.
Other interesting graphs: Core Parking State, Core Parking Concurrency
Benchmarks
Below is a list of sample workloads and the recommended benchmark with a brief description that can be used to compare the results from using different configurations:
Application Server Workload
The SAP-SD benchmark is used to generate an application server workload. A two-tier setup is used, with the database and the application server on the same server host. This workload also utilizes response time as a performance metric, which differs from other tested workloads. Thus it is used to verify the impact of PPM parameters on responsiveness. Nevertheless, it is not intended to be representative of all latency-sensitive production workloads.
Link: SAP Software Solutions | Business Applications and Technology
File Server Workload
FSCT is used to generate an SMB file server workload. It creates a large file set on the server and uses many client systems (actual or virtualized) to generate file open, close, read and write operations. The operation mix is based on statistical studies of production servers. It stresses CPU, disk, and network resources.
Link: Download File Server Capacity Tool v1.3 (64bit) from Official Microsoft Download Center
GeekBench
GeekBench is a cross-platform processor benchmark that separates the scores for single-core and multi-core performance. It simulates a set of workloads including integer workloads (encryptions, compressions, image processing, etc.), floating point workloads (modeling, fractal, image sharpening, image blurring, etc.) and memory workloads (streaming).
Link: Geekbench 5 – Cross-Platform Benchmark
Specpower JAVA Workload
SPECpower_ssj2008 is the first industry-standard SPEC benchmark that jointly evaluates power and performance characteristics. It is a server-side Java workload with varying CPU load levels. It doesn’t require many disk or network resources, but it has certain requirements for memory bandwidth. Almost all of the CPU activity is performed in user-mode; kernel-mode activity does not have much impact on the benchmarks’ power and performance characteristics except for the power management decisions.
Link: SPEC Benchmarks
SQL Server Database Workload
The TPC-E benchmark is a popular benchmark for database performance analysis. It is used to generate an OLTP workload for PPM tuning optimizations. This workload has significant disk I/O, and hence has a high performance requirement for the storage system and memory size.
Link: TPC-Homepage
0 comments