

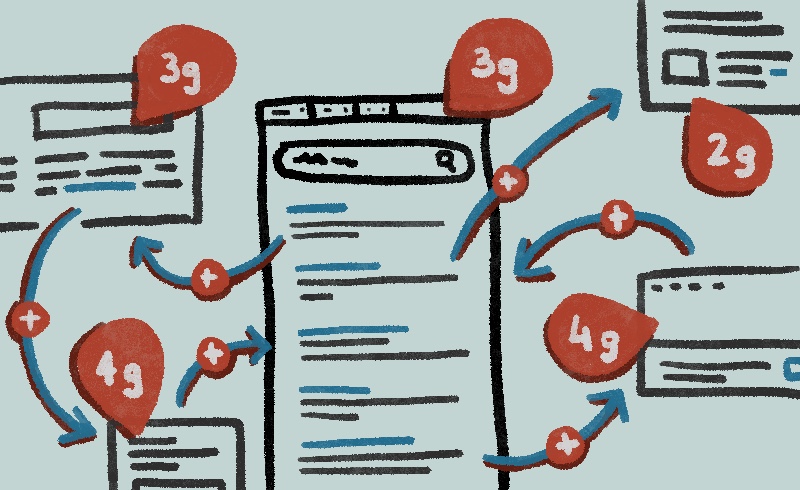
Search, simple click, simple letter typed in the search box have an impact on the environment when browsing Internet.
Under Windows, the user spends on average 60% of his time in the browser; all of his actions can be measured and therefore can be optimized to reduce carbon emissions.
How can we change our behavior? How to know your personal impact as a user and tomorrow how to better code a website as a developer?
To measure the carbon impact of your Internet navigation, a simple solution proposed by TheShiftProject called 1bit can provide a first result. “Carbonalyser”: the browser extension which reveals the climate impact of internet navigation – The Shift Project
This model is based on the data traffic and the average consumption of a PC. The CO2 conversion is calculated on an average basis of the carbon intensity of the selected region or country.
This model can be improved by adding more accurate device consumption information and by adding the real time carbon intensity of the region or country.
In France, the real time carbon intensity is available via RTE Eco2mix – Production d’électricité par filière en France | RTE (rte-france.com).
An example of carbon intensity display in a web extension is given by Jen Looper Build a ‘Green’ Browser Extension | Sustainable Software (microsoft.com).
A web extension can go further and capture browsing information to calculate the user’s carbon impact.
Network traffic is an important data because it reflects the user’s activity. The higher the volume of exchanges, the higher the power consumption to process this data. Here is an example of code to capture the size of requests by domain.
handleMessage = (request) => {
   chrome.webRequest.onHeadersReceived.addListener(
      headersReceivedListener,
      {urls: ['<all_urls>']},
      ['responseHeaders']
   );
   return;
}

headersReceivedListener = (requestDetails) => {
     const origin = extractHostname(!requestDetails.initiator ? requestDetails.url : requestDetails.initiator);
     const responseHeadersContentLength = requestDetails.responseHeaders.find(element => element.name.toLowerCase() === "content-length");
     const contentLength = undefined === responseHeadersContentLength ? {value: 0}
      : responseHeadersContentLength;
     const requestSize = parseInt(contentLength.value, 10);
     AddRequestSizeByOrigin(origin, requestSize); // todo

     return {};
  }

extractHostname = (url) => {
  let hostname = url.indexOf("//") > -1 ? url.split('/')[2] : url.split('/')[0];
  // find & remove port number
  hostname = hostname.split(':')[0];
  // find & remove "?"
  hostname = hostname.split('?')[0];
  return hostname;
};

chrome.runtime.onMessage.addListener(handleMessage);
CPU consumption is also an important data by domain. Since Chrome version 92, a new Compute Pressure API Observing compute pressure (web.dev) is available that allows web applications to get an overview of CPU usage. The API provides a callback that receives periodic updates, allowing developers to observe changes in CPU usage over time. A web application or extension that uses this API can inform the user and enable or disable features based on the results. For example, lowering the quality of a video or stopping CSS animations.
function callback(update) {
  if (update.cpuSpeed > 0.5) {
    // The CPU is running at faster than base speed.
  } else {
    // The CPU is running at normal or reduced speed.
  }

  if (update.cpuUtilization >= 0.9) {
    // CPU utilization is over 90%.
  } else if (update.cpuUtilization >= 0.75) {
    // CPU utilization is over 75%.
  } else if (update.cpuUtilization >= 0.5) {
    // CPU utilization is over 50%.
  } else {
    // CPU utilization is under 50%.
  }
}

const observer = new ComputePressureObserver(callback, {
  // Thresholds divide the interval [0.0 .. 1.0] into ranges.
  cpuUtilizationThresholds: [0.5, 0.75, 0.9],
  // The minimum clock speed is 0.0, and the maximum speed is 1.0.
  // 0.5 represents the base clock speed.
  cpuSpeedThresholds: [0.5],
});

// Begin observing changes and triggering callbacks:
observer.observe();

// ...later on, to stop observing changes:
observer.unobserve();
Processors will play an important role in the future of power consumption. Their adaptation to applications will be key in this optimization quest. (Read Raymond Li’s article on this subject with the new Windows APIs https://aka.ms/sse/blog/IntroducingEcoQoS.
In the same way as the application realized with CSN Energy on the real time consumption of a device under Windows 10 with the application WeDeex (https://aka.ms/wedeex) Article : We need a Yuka for electricity to ease the energy transition | Sustainable Software (microsoft.com)
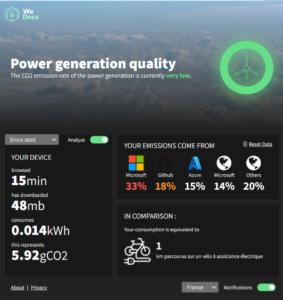
CSN Energy has made available a Chrome/Edge extension to display the carbon footprint of a user’s web browsing based on TheShiftProject’s 1bit model and inform the user in real time of the carbon intensity. Intensity accessible via CSN services as an API (GitHub – Wedeex-DevTeam/WedeexApp: This repos is about sharing an example of UWP application that relies on Wedeex API’s)
 |
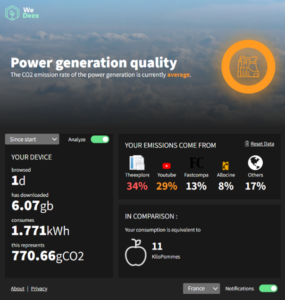 |
This extension is available here (WeDeex – Microsoft Edge Addons)
This extension will allow a user to realize the carbon impact of their web browsing and thus to change their behavior according to the carbon intensity of the moment. For example, the user can connect a little later to emails or favorite video streaming site while waiting for the carbon intensity to be better in their area or country. The user can be informed of this change by notification.
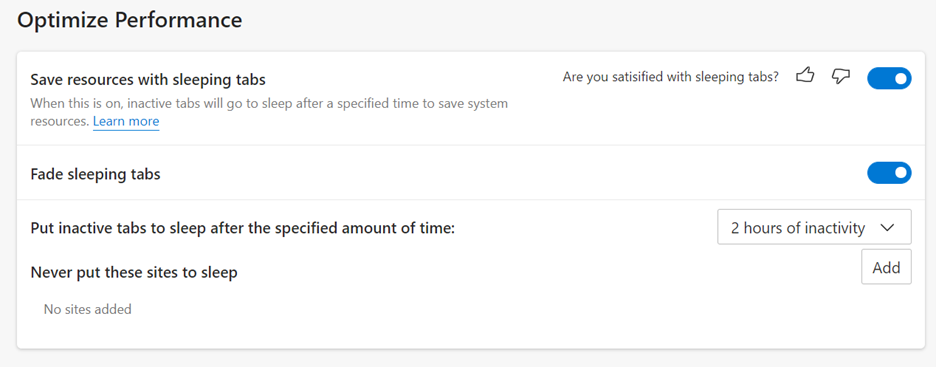
About Edge on Windows a new feature could be enabled by users and explored by developers. “Sleeping tabs”
If you are a developer, you can deactivate some functionalities on your website if the tab is hidden. For example, a 2019 study by researchers at the University of Bristol, showed that disabling audio/video if the browser tab is not active can significantly reduce carbon emissions. (Source: Evaluating Sustainable Interaction Design of Digital Services | Proceedings of the 2019 CHI Conference on Human Factors in Computing Systems (acm.org))
And all of us can start activating “sleeping tabs” in Edge to save resources and reduce carbon emission. And monitor your country carbon intensity before watching a long video 😊
0 comments