


As more and more customers are becoming reliant on the Semantic Kernel SDK to create sophisticated and powerful applications, we have heard the need for greater transparency into end-to-end traceability and debugging. For example, if you want to know how a specific plugin can impact performance or looking for a way to debug a request this blog post is for you.
We have chosen to use Azure Application Insights, but feel free to use any telemetry provider of your choice, such as Prometheus. Apologies for the longer than usual blog post but we have some goodness to share!
Key Benefits of effective product telemetry
So why you should use effective product telemetry? Product telemetry refers to the process of collecting and analyzing data from software applications to gain insights into the following:
- Bug Detection and Debugging: Telemetry enables near real-time monitoring of applications, allowing prompt detection and diagnosis of issues or bugs. This leads to faster resolution times and improves overall software quality. To do this successfully your application needs to have tracing.
- Performance Optimization: By tracking application performance metrics, you can identify bottlenecks and areas for optimization. This data-driven approach ensures that the application operates at its best, enhancing user experience.
- Proactive Maintenance: Telemetry allows proactive maintenance as you can anticipate potential problems and address them before they escalate, reducing downtime and enhancing product reliability.
- Data-Driven Decision Making: With telemetry, decisions can be based on data rather than assumptions, resulting in more effective and successful product development strategies.
Get Started with Telemetry in Semantic Kernel SDK
Logging is implemented with ILogger interface from Microsoft.Extensions.Logging namespace, Semantic Kernel uses the following log levels:
- Information – This is the default enabled log level. This level provides information about the general flow of the application and contains the following data:
- AI model used to create a plan.
- Plan creation status (Success/Failed).
- Plan creation execution time (in seconds).
- Created plan without plugin arguments.
- AI model used to execute a plugin.
- Plugin execution status (Success/Failed)
- Plugin execution time (in seconds)
- Debug – contains more detailed messages without sensitive data. This can be enabled in production environments.
- Warning – includes information about unusual events that don’t cause the application to fail.
- Error – used for logging exception details.
- Trace – this log level is the most verbose and should not be enabled in production environments since it may contain sensitive data. This is a great choice for test environments for increased levels of observability. Logged information includes:
- Goal/Ask to create a plan.
- Prompt (template and rendered version) for AI to create a plan.
- Created plan with function arguments (arguments may contain sensitive data).
- Prompt (template and rendered version) for AI to execute a plugin.
The snippet below illustrates how to set up your software to send logs to Azure Monitor / Application Insights:
using var loggerFactory = LoggerFactory.Create(builder =>
{
    // Add OpenTelemetry as a logging provider
    builder.AddOpenTelemetry(options =>
    {
        options.AddAzureMonitorLogExporter(options => options.ConnectionString = yourConnectionString);
        // Format log messages. This defaults to false.
        options.IncludeFormattedMessage = true;
    });
    builder.SetMinimumLevel(LogLevel.Warning);
});

IKernelBuilder builder = Kernel.CreateBuilder();
builder.Services.AddSingleton(loggerFactory);
builder.AddAzureOpenAIChatCompletion(/* Your configuraton */).Build();
Tracing
Traces are data that track requests as they flow through the various systems of an application. Traces record how long it takes each component to process requests. To apply tracing to aid with data flow observability you can use the Activity Class from System.Diagnostics namespace.
To subscribe to the available activity source use ‘Activity Listener’
using var traceProvider = Sdk.CreateTracerProviderBuilder()
    .AddSource("Microsoft.SemanticKernel*")
    .AddAzureMonitorTraceExporter(options => options.ConnectionString = yourConnectionString)
    .Build();
You can subscribe to a specific activity source by passing it to the AddSource() method.
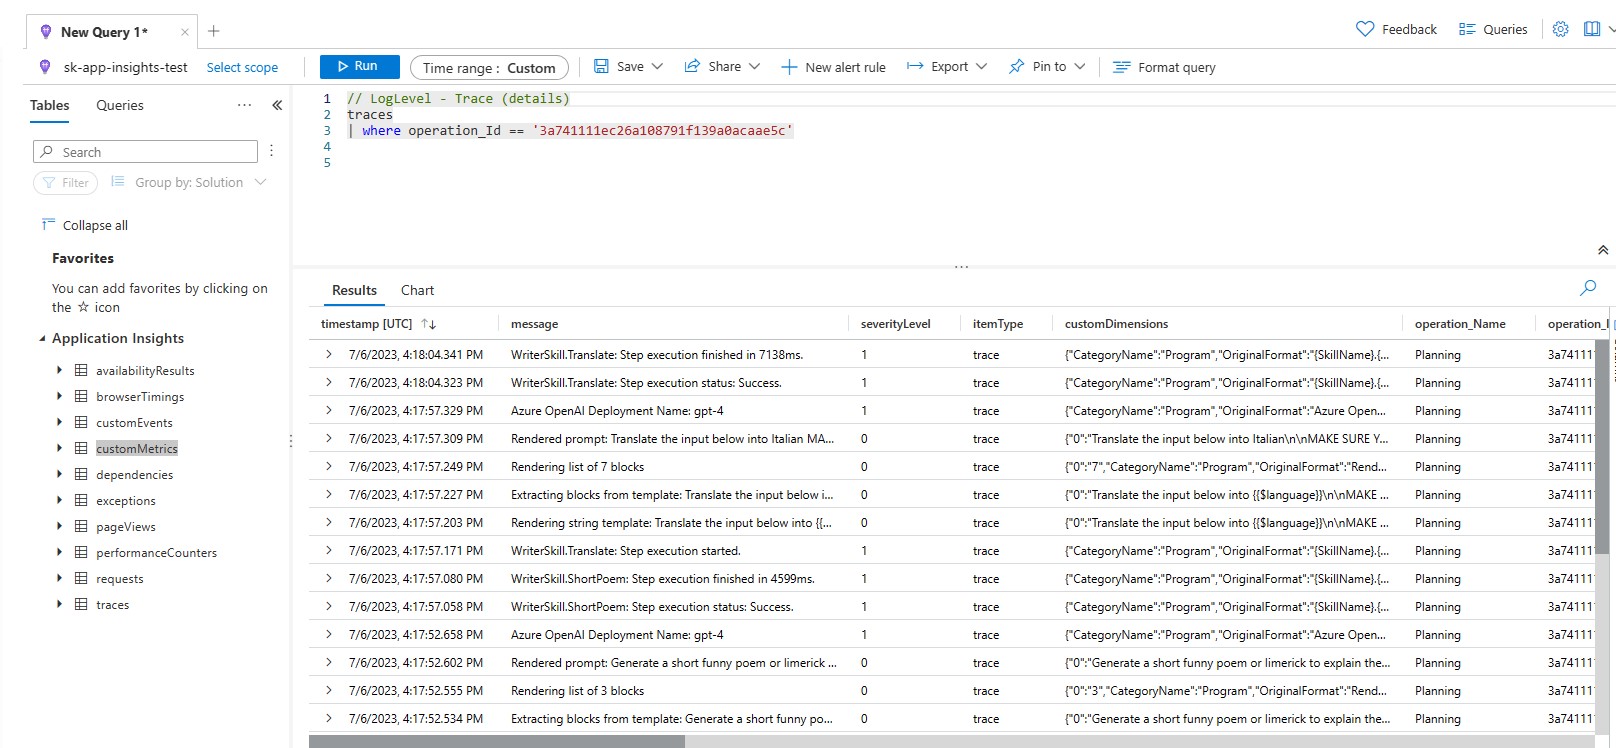
Once applied you will be able to view traces like the below from Azure Application Insights.
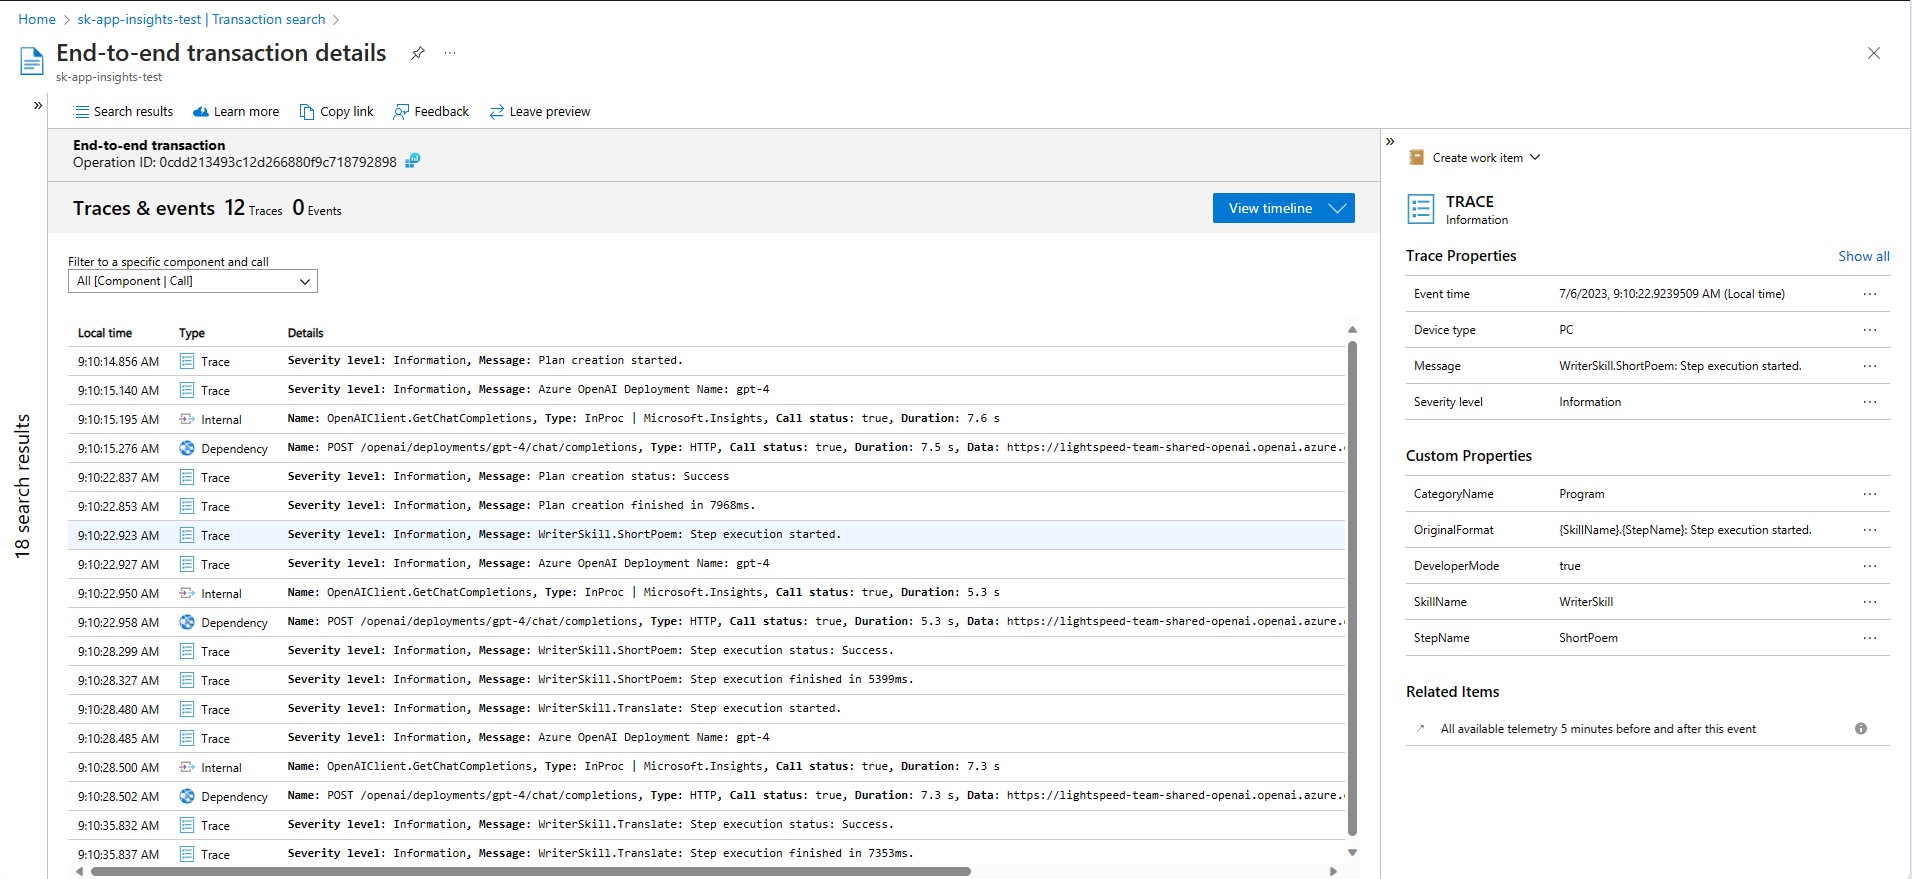
Or integrate with log queries to view end to end traces across key components including plugins, planners and model end points.
Metering
This is great when you require understanding of your applications performance. Metering is implemented with Meter class from System.Diagnostics.Metrics namespace. For a list of available metrics, see the Metering section of the telemetry documentation.
Depending on your telemetry monitoring choice, subscribing to events may vary. The following example shows you can subscribe to SemanticKernel:
using var meterProvider = Sdk.CreateMeterProviderBuilder()
    .AddMeter("Microsoft.SemanticKernel*")
    .AddAzureMonitorMetricExporter(options => options.ConnectionString = yourConnectionString)
    .Build();
If you want to subscribe to a specific meter, you can provide it as the argument to another AddMeter() call.
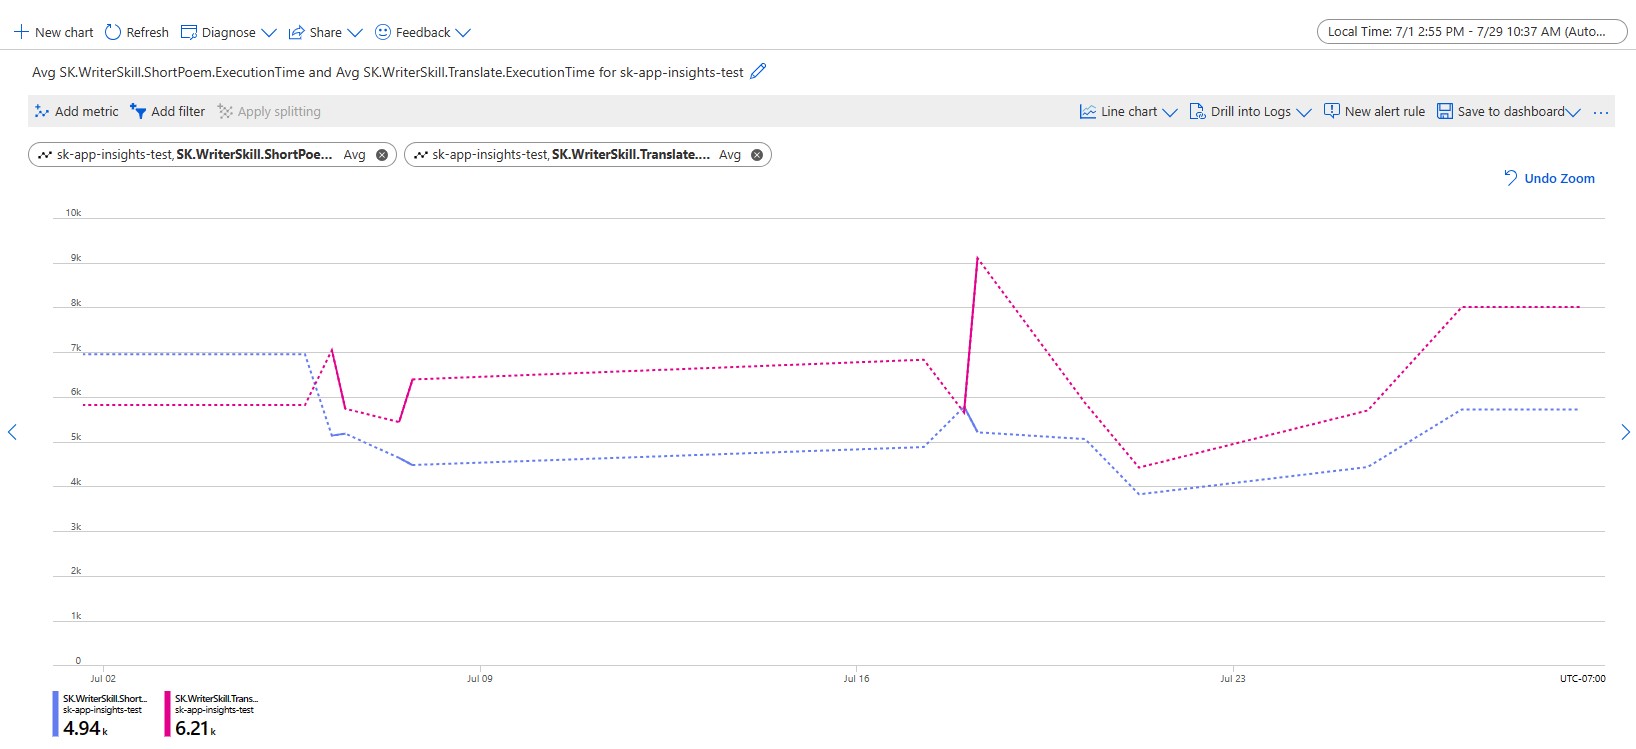
Once you have implemented metering you can build metric views similar to the one below from Azure Application Insights to observe how different plugin execution times compare.
In closing, telemetry forms the backbone of modern software development, and the Semantic Kernel SDK. By harnessing telemetry data, you can gain invaluable insights, improve application performance, and build products that truly resonate with users. Embrace telemetry in your Semantic Kernel SDK projects, and unlock the potential to elevate your applications to new heights of success. Happy coding!
Next Steps:
- Learn more about Telemetry in Semantic Kernel and implementation information here.
- Join the community and provide feedback on Semantic Kernel.

0 comments