Summary: Guest blogger, Tom Stringer, illustrates how to troubleshoot an AlwaysOn availability group by using Windows PowerShell.
Microsoft Scripting Guy, Ed Wilson, is here. We welcome back guest blogger, Thomas Stringer, for Part 3 of this three-part series. To catch up, read:
Part 1: Set Up an AlwaysOn Availability Group with PowerShell
Part 2: Monitor an AlwaysOn Availability Group with PowerShell
Thomas Stringer is a SQL Server premier field engineer at Microsoft. He specializes in scripting (Windows PowerShell), high availability, disaster recovery, performance tuning, internals, querying, and database administration. He also has a software development background in languages and platforms from C all the way through .NET (including C# for WinForm and ASP.NET WebForms/MVC applications).
Email: sqlsalt@outlook.com
Blog: http://sqlsalt.com
Twitter: @SQLife
LinkedIn: Thomas Stringer
Here’s Tom…
In the first part of this series on AlwaysOn availability groups and Windows PowerShell, I talked about how to set up and configure an availability group. In the second part, I showed you a few ways you can use to monitor availability groups. By now, you are most likely seeing the progression of my publications, and today we’re going to be talking about how to troubleshoot an AlwaysOn availability group through the use of Windows PowerShell.
Say your availability group is all set up and you’re actively monitoring it. All of a sudden, you start seeing errors or your data synchronization seizes. Where do you look now? How can you troubleshoot this issue?
Depending on the nature of the issue and the symptoms, I almost always default directly to the SQL Server error log.
Note I also investigate the AlwaysOn_Health Extended Events session—but that’s not quite as accessible through Windows PowerShell. It is worth mentioning though. For thorough troubleshooting, looking through the collected events in this session is extremely helpful.
AlwaysOn availability groups is a relatively chatty technology, whether the situation is good, bad, or indifferent. The SQL Server error log reads like a story for availability groups, especially with role transitioning and connectivity. There are a few situations that can cause the database to go into a suspect state and stop data synchronization. But investigation needs to take place to find exact proof and the root cause of the issue.
What do we do first? Well, let’s first verify the state of the database. The first step is to load SMO and create our Server objects to point to our primary and secondary replicas. I mentioned in the last post that we can also loop through a list of replica names or use the listener to connect to the primary. For simplicity’s sake, I will be explicit here:
$SqlServerPrimaryName = “ALWAYSON1”
$SqlServerSecondaryName = “ALWAYSON2”
[System.Reflection.Assembly]::LoadWithPartialName(“Microsoft.SqlServer.Smo”) |
Out-Null
$SqlServer = New-Object Microsoft.SqlServer.Management.Smo.Server($SqlServerPrimaryName)
$SqlServerSec = New-Object Microsoft.SqlServer.Management.Smo.Server($SqlServerSecondaryName)
Note In this blog post, my test availability group is named “AgTest100”.
Now we will run a quick command to see and verify what is happening:
$SqlServer.AvailabilityGroups[“AgTest100”].DatabaseReplicaStates |
Select-Object AvailabilityReplicaServerName,
AvailabilityDatabaseName,
IsLocal,
IsSuspended,
SuspendReason
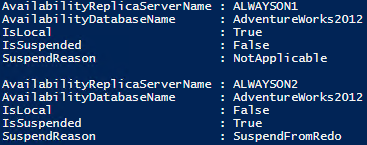
Here is my output when I’m in this state:
Notice the second item. It’s the remote secondary replica’s database (AdventureWorks2012). What’s important here is that it is suspended from redoing transactions. Let’s get a little more information as to what the problem is right from the secondary replica:
$SqlServerSec.Databases[“AdventureWorks2012”] |
Select-Object Name, Status
I get the following result, showing me that the database is suspect:
So we have the surrounding issue: we have suspended data movement and a suspect availability group database on the secondary replica. Now we need to find out why this is happening. I head to the SQL Server error log immediately to see what’s happening. On the secondary replica I want to look at the SQL Server error log with any error messages that contain my database that is now suspect:
$SqlServerSec.ReadErrorLog() |
Where-Object {$_.Text -like “*AdventureWorks2012*”} |
Select-Object LogDate, Text |
Format-List
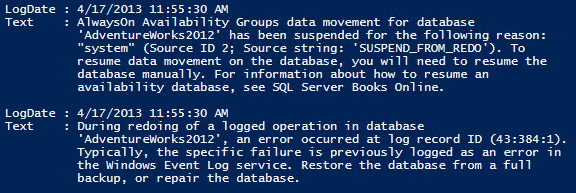
The most recent errors tell me that an error has occurred:
This really only tells me what I already know. So let’s refine our search a little bit. We know that the issue occured on or around 4/17/2013 at 11:55 AM, so let’s get all the log records from that time span to get the full picture (I choose a two minute window):
$SqlServerSec.ReadErrorLog() |
Where-Object {
$_.LogDate -ge “4/17/2013 11:54:00 AM” -and
$_.LogDate -le “4/17/2013 11:56:00 AM”} |
Select-Object LogDate, Text |
Format-List
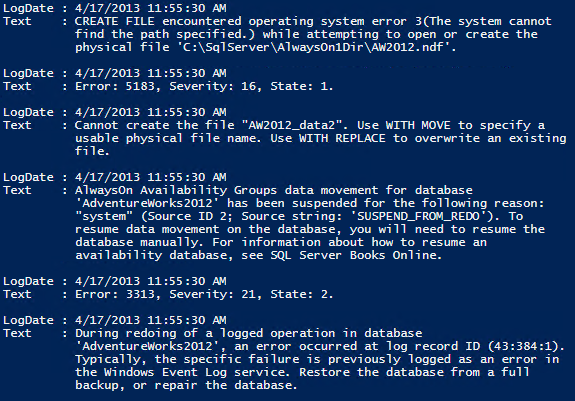
Here’s what that output looks like on my computer:
Bingo! So now we see exactly what the issue is. There was CREATE FILE command that came from the primary replica, and when that transaction went through the redo phase on the secondary replica, it failed because of a mismatch in the directory structure between the two replicas. The fix for this issue is out of the scope of this blog post, but if you happen to run into this issue, the resolution can be found in my blog post, Adding Database Files to an AlwaysOn Availability Group Database (Part 2 – The Reactive Way).
Another potential issue that can be seen with availability groups is connectivity issues. Behind the scene, SQL Server utilizes the database mirroring endpoint for each of the instances that are participating in an availability group to send transactions to the secondary replicas. Like any other network traffic and communication, you could be experiencing issues. To grab information about any connectivity issues that could be happening, you can pull three items from SQL Server through SMO: LastConnectErrorNumber, LastConnectErrorDescription, and LastConnectErrorTimestamp.
$SqlServer.AvailabilityGroups[“AgTest100”].AvailabilityReplicas |
Select-Object Name,
LastConnectErrorNumber,
LastConnectErrorDescription,
LastConnectErrorTimestamp
$SqlServerSec.AvailabilityGroups[“AgTest100”].AvailabilityReplicas |
Select-Object Name,
LastConnectErrorNumber,
LastConnectErrorDescription,
LastConnectErrorTimestamp
This is just more diagnostic data that will paint the picture of what the issue is, and lead you to what the solution may be.
AlwaysOn availability groups (and failover cluster instances) are interesting technologies. AlwaysOn availability groups are SQL Server, but they also sit right on top of Windows Server Failover Clustering. As DBAs, there is a good chance that our daily work may not utilize this Windows Server technology. But as we will see now, it will become rather important to be familiar with the basics of Windows Server Failover Clustering and where to look when troubleshooting cluster issues.
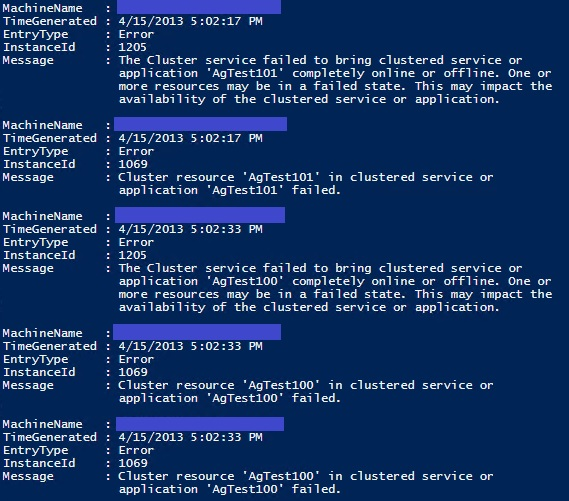
Much like SQL Server, there is valuable information that we can gather from the logs that contain clustering information for troubleshooting. These cluster events are stored in the System Event Log on the nodes in the cluster. If you are troubleshooting an issue and trying to look from a time span of the past day, you could use the following Windows PowerShell script to gather the System Event Log events for the cluster on both of the nodes:
$ClusterEvents = foreach ($NodeName in @(“ALWAYSON1”, “ALWAYSON2”)) {
Get-EventLog -ComputerName $NodeName -LogName System |
Where-Object {
$_.Source -eq “Microsoft-Windows-FailoverClustering” -and
$_.TimeGenerated -ge “4/15/2013 1:00:00 PM” -and
$_.TimeGenerated -le “4/16/2013 1:00:00 PM”} |
Select-Object MachineName, TimeGenerated,
EntryType, InstanceID, Message
}
$ClusterEvents |
Sort-Object TimeGenerated
All this script does is loop through each of the nodes and gets the event log contents with a source of failover clustering, and a time span of a day.
There are a few other “gotchas” on the clustering side that we simply can’t see or control within SQL Server. One of those is the RegisterAllProvidersIP cluster parameter for the listener. If you are utilizing multiple subnets, and you’re having connection timeouts intermittently, or just high latency on the connection, it could be because you’re not setting (or your driver doesn’t have the capability for) MultiSubnetFailover.
Out-of-the-box, the listener has a parameter called RegisterAllProvidersIP that is set to 1. This dictates whether the cluster will publish all IP addresses (even if they are offline) so that clients with MultiSubnetFailover can attempt connection to all of them simultaneously. For more information about the impact this has, please see Create or Configure an Availability Group Listener (SQL Server).
To retrieve this cluster setting, you can utilize the FailoverClusters Windows PowerShell module.
Note You have to run this Windows PowerShell script on a computer that has the aforementioned module readily available.
Get-Cluster -Name “ClusterName” |
Get-ClusterGroup -Name “AgTest100” |
Get-ClusterResource |
Get-ClusterParameter |
Where-Object {$_.Name -eq “RegisterAllProvidersIP”} |
Select-Object ClusterObject, Name, Value
This will give you an output similar to the following, which shows whether this parameter is set to 1 (enabled) or 0 (disabled):
Here you can see that I have it set to 1 (the default), and this could potentially be causing my connection issues.
Another possible issue could be that you are having too many failovers within a certain period of time. There is a driving threshold that can prevent a potential automatic failover when you expect it. By default, that threshold is set to a maximum failures of NodeCount – 1 over a period of six hours. So for a two-node cluster, that’ll be one failover for a six-hour period. To get this setting for the availability group, we can use the following script:
Get-Cluster -Name “ClusterName” |
Get-ClusterGroup -Name “AgTest100” |
Select-Object Name, FailoverPeriod, FailoverThreshold
I get the following output in my environment:
This basically means that when I reach my threshold of one failover in a six-hour period, automatic failover will not take place.
We’ve looked at a few settings that could be giving us problems on the cluster side of the availability group. A great way to see what’s happening if we have a failed availability group is to see the state of all the availability group’s cluster resources:
Get-Cluster -Name “ClusterName” |
Get-ClusterGroup -Name “AgTest100” |
Get-ClusterResource |
Select-Object Name, State, ResourceType
My cluster has the following output:
I’ve shown you today a few methods that can be used when you are trying to troubleshoot AlwaysOn availability groups. Through the flexibility and efficiency of Windows PowerShell, you can effortlessly comb through many avenues of diagnostics to determine what the problem area may be with your currently high availability solution. Enjoy!
~Thomas
Thank you, Thomas, for an awesome series. Join us tomorrow as SQL Server Week continues with a guest blog by SQL Server MVP, Sean McCowan.
I invite you to follow me on Twitter and Facebook. If you have any questions, send email to me at scripter@microsoft.com, or post your questions on the Official Scripting Guys Forum. See you tomorrow. Until then, peace.
Ed Wilson, Microsoft Scripting Guy


0 comments