Summary: Microsoft Scripting Guy Ed Wilson shows how to use Windows PowerShell to parse the Windows Firewall log.
![]() Hey, Scripting Guy! I am wondering about the firewall log on my computer. I was in a hotel recently, and I noticed that the network adapter light kept flashing, but I was not like doing anything really. When I tried to look at the firewall log, it seems there was nothing there. Did they get rid of the firewall log in Windows 7? If they did not, where is it? Oh, yeah, if there is a firewall log, can you show me how to use Windows PowerShell to search it for cool stuff, so I can maybe figure out why the network is going crazy, when I am not doing anything?
Hey, Scripting Guy! I am wondering about the firewall log on my computer. I was in a hotel recently, and I noticed that the network adapter light kept flashing, but I was not like doing anything really. When I tried to look at the firewall log, it seems there was nothing there. Did they get rid of the firewall log in Windows 7? If they did not, where is it? Oh, yeah, if there is a firewall log, can you show me how to use Windows PowerShell to search it for cool stuff, so I can maybe figure out why the network is going crazy, when I am not doing anything?
—BP
![]() Hello BP,
Hello BP,
Microsoft Scripting Guy Ed Wilson here. Having recently returned from a road trip that entailed nearly two weeks in hotels, I can sympathize with you about connecting to strange networks. I can assure you that the firewall in Windows 7 does in fact possess the ability to create a log. Whether or not that log is enabled is a matter of personal preference, Group Policy preference, or default behavior.
First, the defaults: on both Windows 7 and Windows Server 2008 R2, Windows Firewall is enabled, and the logs are created in the %systemroot%\system32\logfiles\firewall directory. The file is called pfirewall.log. Unfortunately, the default logging behavior is to not log dropped packets or successful connections, which means there is no logging actually going on. I recommend changing this to log both dropped packets and successful connections.
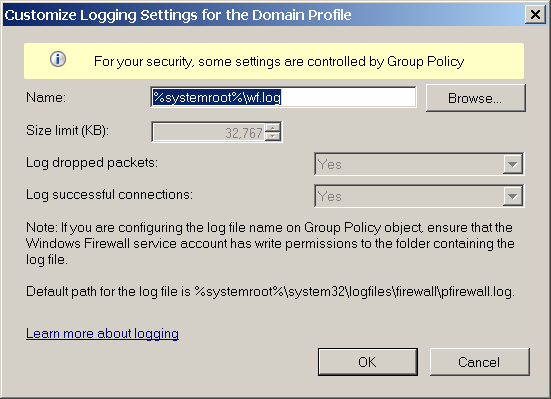
Second, Windows Firewall logging can be controlled via Group Policy. In this case, you would not be able to change any of the logging settings. Via Group Policy, the logging level and the log storage location are configurable. The following figure shows the firewall log details on a computer that has settings managed via Group Policy. In the figure, you can see that both the location and the log name have changed from the defaults.
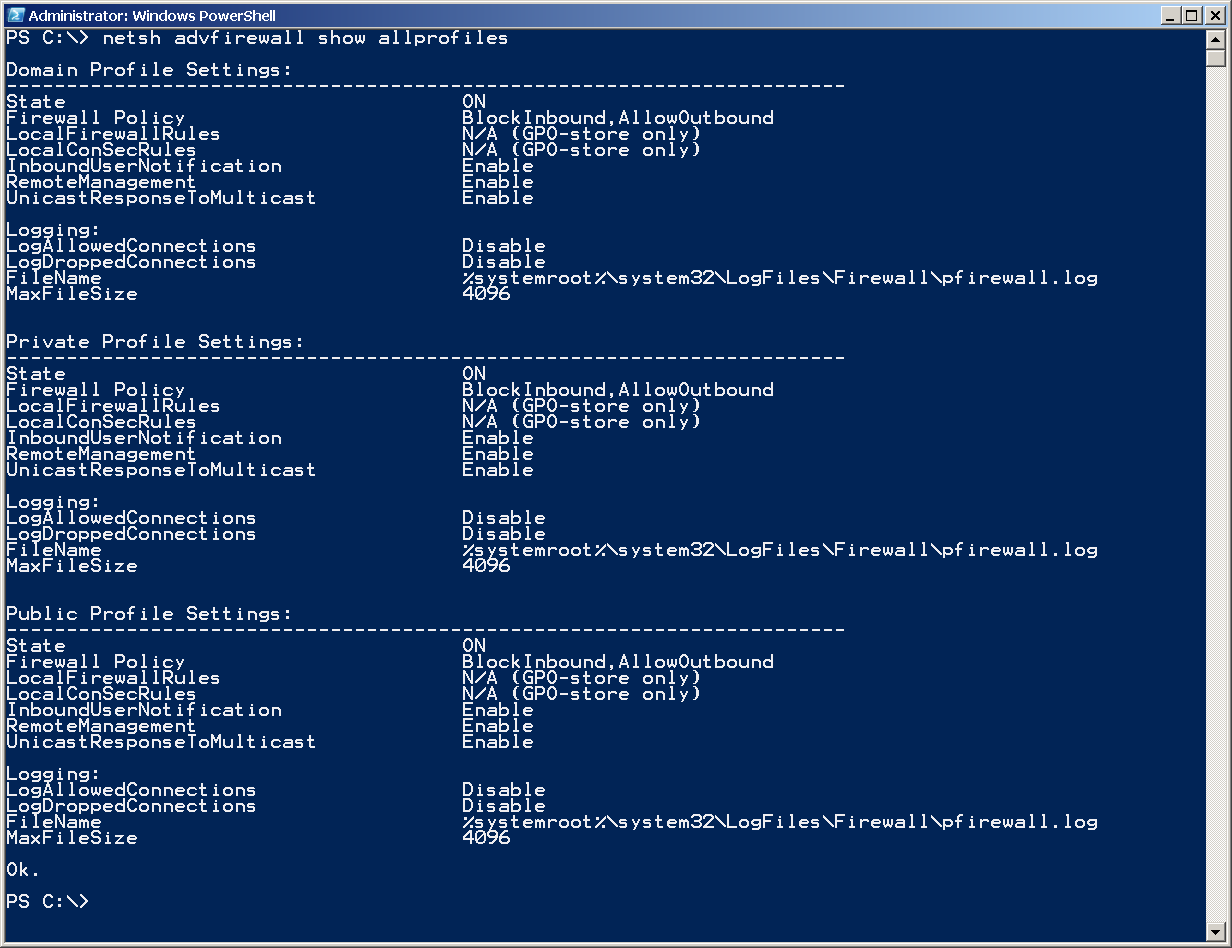
In addition, because the Windows Firewall can be set with different settings based on the detected network connection type, you could have different logging taking place from the Domain profile, the Private profile, and the Public profile. I would not necessarily recommend this configuration, but it certainly could be done. From a management standpoint, I think it would be easier to simply log both successful connections and dropped packets to the same log from all three firewall profiles—in this way, only one log file must be parsed. I also recommend keeping both the default location and the default name of the firewall log as well. If default log names and locations are maintained, it makes it easy for scripts to obtain the information. The NetSh utility can be used to obtain logging locations for the three different profiles. The actual NetSh command is shown here:
netsh advfirewall show allprofiles
The command and output are shown in the following figure.
I can use the Select-String cmdlet to parse that output and return the firewall log locations. This command and associated output are shown here:
PS C:\> netsh advfirewall show allprofiles | Select-String Filename
FileName %systemroot%\system32\LogFiles\Firewall\pfirewall.log
FileName %systemroot%\system32\LogFiles\Firewall\pfirewall.log
FileName %systemroot%\system32\LogFiles\Firewall\pfirewall.log
From examining the above output, I am able to see that all logging takes place in the same log. I am not able to use %systemRoot% directly from within Windows PowerShell. I can, however, use the systemroot environmental variable, as shown in the following code:
PS C:\> $env:SystemRoot
C:\Windows
I can even use the –replace operator, and replace %systemroot% if I wish to do so, as shown here (the % symbol is an alias for the ForEach-Object cmdlet):
PS C:\> netsh advfirewall show allprofiles | Select-String Filename | % { $_ -replace “%systemroot%”
,$env:systemroot }
FileName C:\Windows\system32\LogFiles\Firewall\pfirewall.log
FileName C:\Windows\system32\LogFiles\Firewall\pfirewall.log
FileName C:\Windows\system32\LogFiles\Firewall\pfirewall.log
BP, the one thing to keep in mind when working with any log that is stored in the windows directory is that it will require administrator rights for access. In Windows PowerShell, this means right-clicking the Windows PowerShell icon, and selecting Run as Administrator from the shortcut menu.
Using the Select-String cmdlet, I can read and parse the log in one operation. This command appears here. For readability, I am going to store the path in the firewall log in a variable. This variable assignment is shown here:
$fwlog = “C:\Windows\system32\LogFiles\Firewall\pfirewall.log”
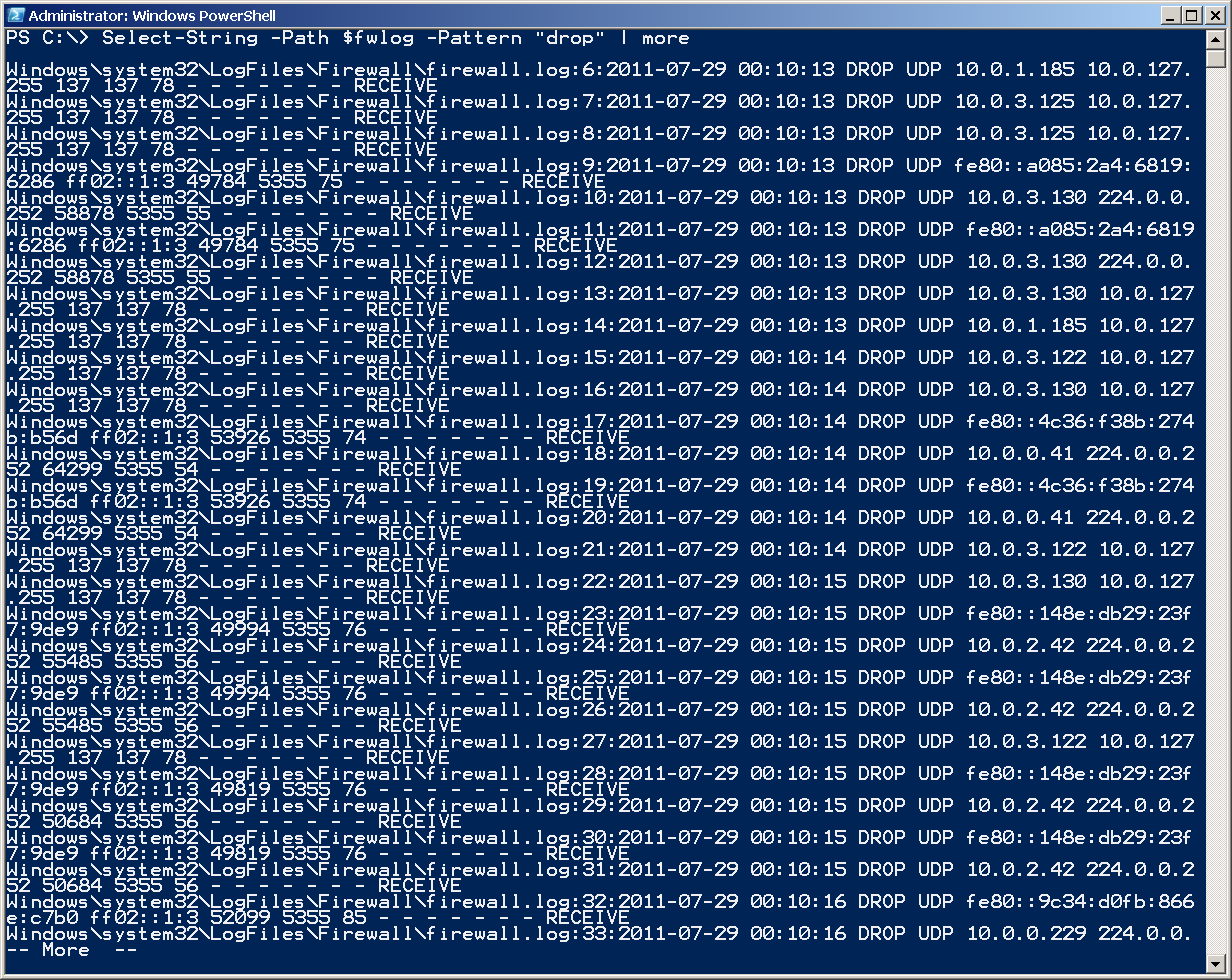
Select-String -Path $fwlog -Pattern “drop”
To allow me to read the log, I am going to pipe the output to more. This command is shown here:
Though it is permissible to use the Select-String cmdlet to read and to parse a log at the same time, if I am trying to analyze the log, it is not very efficient. This lack of efficiency is because every time I want to look for something else, I need to read the contents of the log again. Therefore, if I am going to be spending very much time attempting to parse the log and look for different things, I will store the contents of the log into a variable. My commands to store the path to the log in a variable, get the contents of the log, store them in a variable, and finally parse the log contents for the word drop are shown here:
$fwlog = “C:\Windows\system32\LogFiles\Firewall\pfirewall.log”
$logcontents = Get-Content $fwlog
$logcontents | select-string “drop”
If I want to see how many dropped UDP and TCP packets appear in the log, I can obtain that information by using the Measure-Object cmdlet:
PS C:\> $logcontents | Select-String “drop udp” | Measure-Object
Count : 33436
Average :
Sum :
Maximum :
Minimum :
Property :
So, there are 33,436 dropped UDP packets. What is the timespan that is covered by this log? To figure this out, I use the Select-Object cmdlet (the alias is select). I choose the -first and the -last entries.
PS C:\> $logcontents | Select-String “drop udp” | select -First 1
2011-07-29 00:10:13 DROP UDP 10.0.1.185 10.0.127.255 137 137 78 – – – – – – – RECEIVE
PS C:\> $logcontents | Select-String “drop udp” | select -last 1
2011-07-29 01:20:50 DROP UDP 10.0.0.146 10.0.127.255 137 137 78 – – – – – – – RECEIVE
From looking at the preceding entries, it seems the log runs from a little after midnight for about an hour. Actually, we have 33,436 dropped UDP packets in 1 hour and 10 minutes. If I want to look at the number of dropped TCP packets, I perform the same operation. As shown here, there were only 43 dropped TCP packets:
PS C:\> $logcontents | Select-String “drop tcp” | Measure-Object
Count : 43
Average :
Sum :
Maximum :
Minimum :
Property :
I can easily modify the query to find out the numbers of permitted TCP and UDP packets, as shown here:
PS C:\> $logcontents | Select-String “allow udp” | measure-object
Count : 4527
Average :
Sum :
Maximum :
Minimum :
Property :
PS C:\> $logcontents | Select-String “allow tcp” | measure-object
Count : 940
Average :
Sum :
Maximum :
Minimum :
Property :
Other patterns can be used to parse the log file. They would follow standard patterns for either regular expressions or wildcard characters.
I invite you to follow me on Twitter and Facebook. If you have any questions, send email to me at scripter@microsoft.com, or post your questions on the Official Scripting Guys Forum. See you tomorrow. Until then, peace.
Ed Wilson, Microsoft Scripting Guy


0 comments