This post is provided by Senior App Dev Manager, Mark Eisenberg, who spotlights the use of PerfView as a handy tool for debugging Azure Service Fabric applications.
The Service Fabric tooling provides a Diagnostic Events viewer for Visual Studio that displays Event Trace for Windows (ETW) messages generated by the event sources provided with the SDK, ServiceEventSource and ActorEventSource. When working on a project with eight actors, two of which had hundreds of instantiations, it did not take long to swamp the built-in view. It topped out at 5000 messages and then began dropping the oldest messages. In addition, it could not keep up with the message rate.
One thing I learned quickly when debugging an actor-based application, as is the case with any highly concurrent architecture, traditional debuggers prove to be not useful. And the limitations in the Diagnostic Events viewer also quickly made it not helpful. A full-length run of the system generated on the order of 50000 messages in about a minute and half. But I had to see what I had to see and I was assured that the problem was with the viewer and the not the ETW system.
A wise man pointed me to PerfView which despite my advanced years, I had never used. The challenges I ran in to are likely laughable to those people who have had opportunity to troubleshoot real-time problems in Windows-based systems, but this post is for everyone else. BTW, there are several other ways to capture ETW traces when the cluster is running on a real cluster of machines. This article is about using a cluster on a developer’s own machine.
Step 1 – download PerfView from Download PerfView.
It’s standalone so just put the exe someplace convenient.
Step 2 – Make a note of the name(s) of your event source(s)
Open up each of the ServiceEventSource.cs and ActorEventSource.cs files and make a note of the event source name:
[EventSource(Name = "Incelligence-TestWebService-TestWebApi")]
internal sealed class ServiceEventSource : EventSource
[EventSource(Name = "Incelligence-BuildIPMLApplication-Ipml")]
internal sealed class ActorEventSource : EventSource
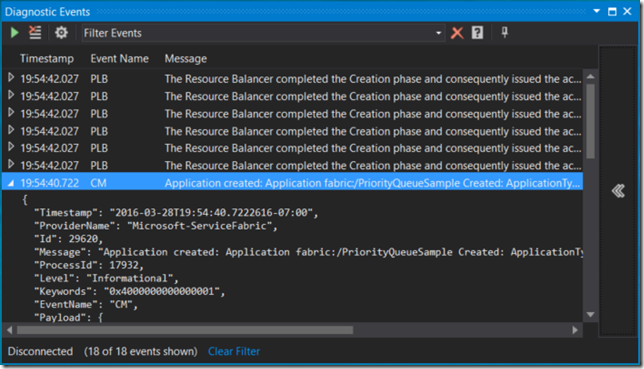
Another way to accomplish this is by running your app with the Diagnostics Events viewer and looking for the “ProviderName” in the JSON for the events in which you are interested:
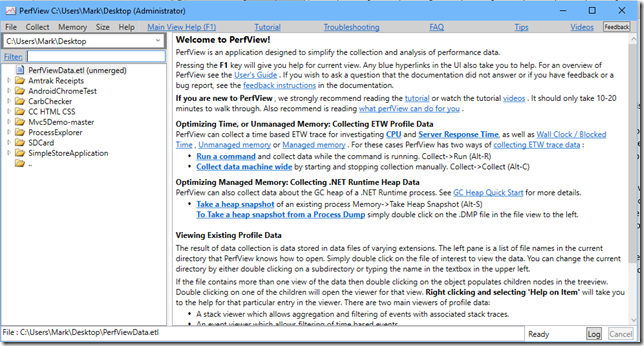
Step 3 – Fire up PerfView
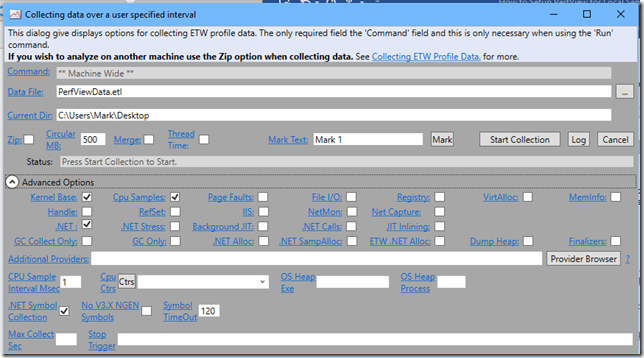
Step 4 – Collect->Collect or Alt-C and expand the advanced options
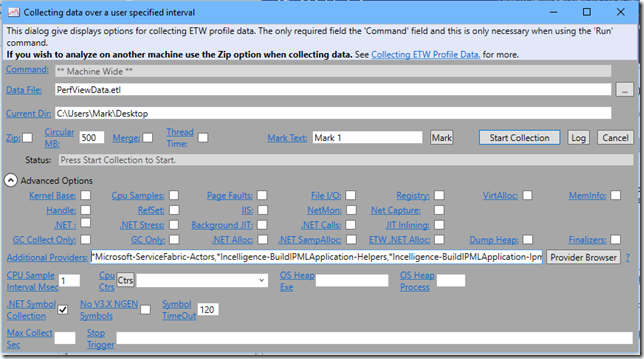
Step 5 – Untick all of the provider boxes and fill in the Additional Providers field with the Service Fabric providers you need such as “*Microsoft-ServiceFabric-Actors” and “*Incelligence-BuildIPMLApplication-Helpers”. Don’t forget the “*”. It is important. Don’t know why, but nothing happens if you leave it out.
Step 6 – Click “Start Collection”
Step 7 – Run your application
Step 8 – Click “Stop Collection”
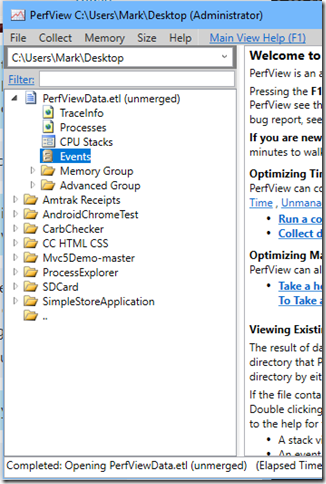
Step 9 – Wait until the processing phase completes which will take a while which results in this:
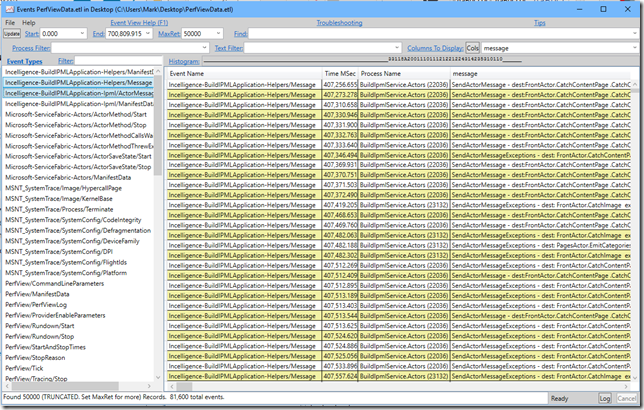
Step 10 – Double-click on Events. Couple of things to note here. The default maximum number of records return is 10000. In the screenshot below I have set it to 50000 and this filter returned 81600 as shown at the bottom of the window. You can select multiple Event Types (I have two selected) and then hit Update. I have also set a filter to only show the message column. Depending on what you are looking for the Text Filter can be invaluable.
Summary – The PerfView tool will reveal everything a developer needs to know about long running Service Fabric applications. It will catch all log messages where the integrated Diagnostics Event viewer can lose messages when the message rate goes to a high level. The developer needs to make sure they properly instrument their code, but if done properly problems cannot stay hidden for long.
Epilogue – I have not run this application in a couple of months and the Service Fabric has been updated since then. Previously, as I mentioned in the introduction, a run would generate on the order of 50000 messages. This run took almost 15 minutes, hit over 700000 records and 9000 ActorMethodThrewException that did not used to be there. Looks like I will I have use what I just wrote about to ferret out whatever has cropped up.
Premier Support for Developers provides strategic technology guidance, critical support coverage, and a range of essential services to help teams optimize development lifecycles and improve software quality. Contact your Application Development Manager (ADM) or email us to learn more about what we can do for you.

0 comments