In this post, App Dev Manager Andy Moore explains the importance of planning for application monitoring during the initial architecture and design phase of new applications.
When designing and building an application, one of the often-overlooked needs is the ability to understand how the application is executing in production. Once deployed, questions arise as to what users are experiencing and what is the impact on the system environment. These thoughts usually occur after a high-priority issue has occurred, or more devastating when a complete down situation has happened. When negligent in planning and utilizing tools that would provide for proactive remediation, developers are left scrambling to understand the application and system state when attempting to piece together the exception puzzle.
Rather than waiting for an inevitable disruption in production, it’s best to plan for application monitoring during the development process, ideally during the initial architecting and design. There are three questions that should be addressed when in this planning phase:
- What options do I have for monitoring my application?
- What information is collected and where does it go?
- How can I take action on this information?
To assist in answering these, Microsoft has provided a robust solution, hosted on Azure, which supplies a suite of services and tools to assist development teams in understanding the real world usage of applications.
Application Insights
Application Insights is an Azure-hosted service which provides for in-depth application monitoring, whether running in the cloud or on-premise. It provides powerful tools for monitoring, analysis, and diagnosis, with such capabilities as live metrics streaming, tracking response times and failure rates, capturing application exceptions, tracking performance counters, and reporting of custom domain logs and events.

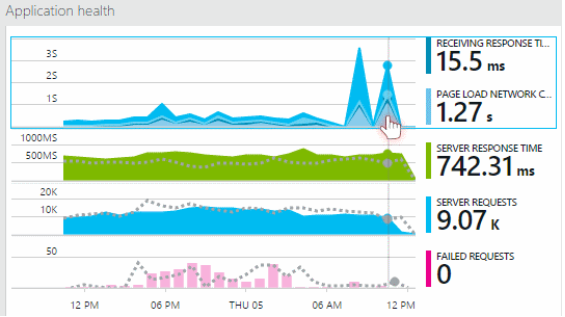
The data collected through Application Insights can be explored through various means, with built in tools provided in the Azure portal for investigation and deep-dives into specific metrics and events. From high level dashboards to low-level profilers there is a wide range of functionality which can be used to assess the health of an application, and in the case of issues to evaluate the state during an exception timeframe.
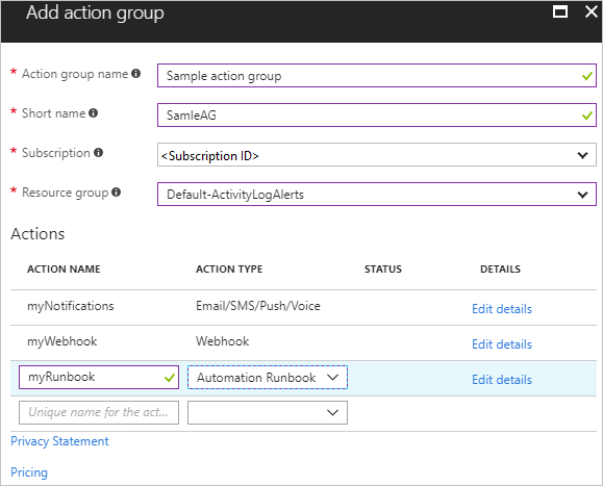
In addition to direct monitoring and investigation, alerts can be configured to invoke a specific action when a given condition is met. Through push notifications and event-driven invocations, automated processes can be created which unload tasks that would otherwise be handled manually.

Proactive, Not Reactive
Application monitoring should not be a reactive thought but rather a planned and utilized process in production execution. By better understanding how an application performs in real world usage, developers can focus efforts on functionality proven to need attention rather than relying on assumptions and speculation. Proactive evaluation using Application Insights will not only bring awareness and knowledge to internal teams, but through actions taken will greatly increase user experience and satisfaction.
Further information, documentation, and tutorials on Application Insights and associated services can be found through the following links:
- Application Insights Animated Introduction – https://www.youtube.com/watch?v=fX2NtGrh-Y0
- What is Application Insights? – https://docs.microsoft.com/en-us/azure/azure-monitor/app/app-insights-overview
- Navigation and Dashboards in the Application Insights portal – https://docs.microsoft.com/en-us/azure/azure-monitor/app/app-insights-dashboards
- Overview of alerts in Microsoft Azure – https://docs.microsoft.com/en-us/azure/azure-monitor/platform/alerts-overview

0 comments