Premier Development Consultant Kurt Schenk demonstrates how to gather real-time performance metrics in a cluster.
Performance (aka. Perfmon) Counters are critical to understanding the health of and diagnosing issues on Windows. In recent performance and scalability testing of a solution built on top of Azure Service Fabric, we collected Perfmon Counters across 15 VMs and sent them to Log Analytics. This was very helpful; however, there were times when we wanted them to be real time. In our case, we wanted to verify core OS Perfmon Counters like Disk, CPU, Memory, Exceptions, and since we were driving load over WebSockets, how many connections were established. In order to enable this, I created a PowerShell script that can easily be configured for the particular Perfmon Counters you want to collect, and machines you want monitor. Ran this script in PowerShell ISE:
# uncomment the line below and run by itself to help you find the correct name for the Perfmon Counters you are interested in
#(get-counter -listset ".NET CLR Memory").paths

$listOfMetrics = @(
      "\LogicalDisk(c:)\% Free Space"
      "\LogicalDisk(d:)\% Free Space",
      "\LogicalDisk(d:)\Free Megabytes",
      "\processor(_Total)\% processor time",
      "\Memory\Available MBytes",
      "\TCPv4\Connections Established",
      "\.NET CLR Exceptions(_global_)\# of Exceps Thrown / sec",
      "\.NET CLR Memory(_global_)\% Time in GC"
)

$vms2 = "zero000000", "zero000001", "zero000002", "zero000003", "zero000004", "zero00000J", "zero00000K", "zero00000L", "zero00000M", `
"zero00000N", "zero00000O", "zero00000X", "zero00000Y", "zero00000Z", "zero000010"

Get-counter -Counter $listOfMetrics -SampleInterval 1 -MaxSamples 1 -ComputerName $vms2 | select -expand countersamples | `
Out-GridView #Format-Table -AutoSize # | Sort-Object Path | Tree
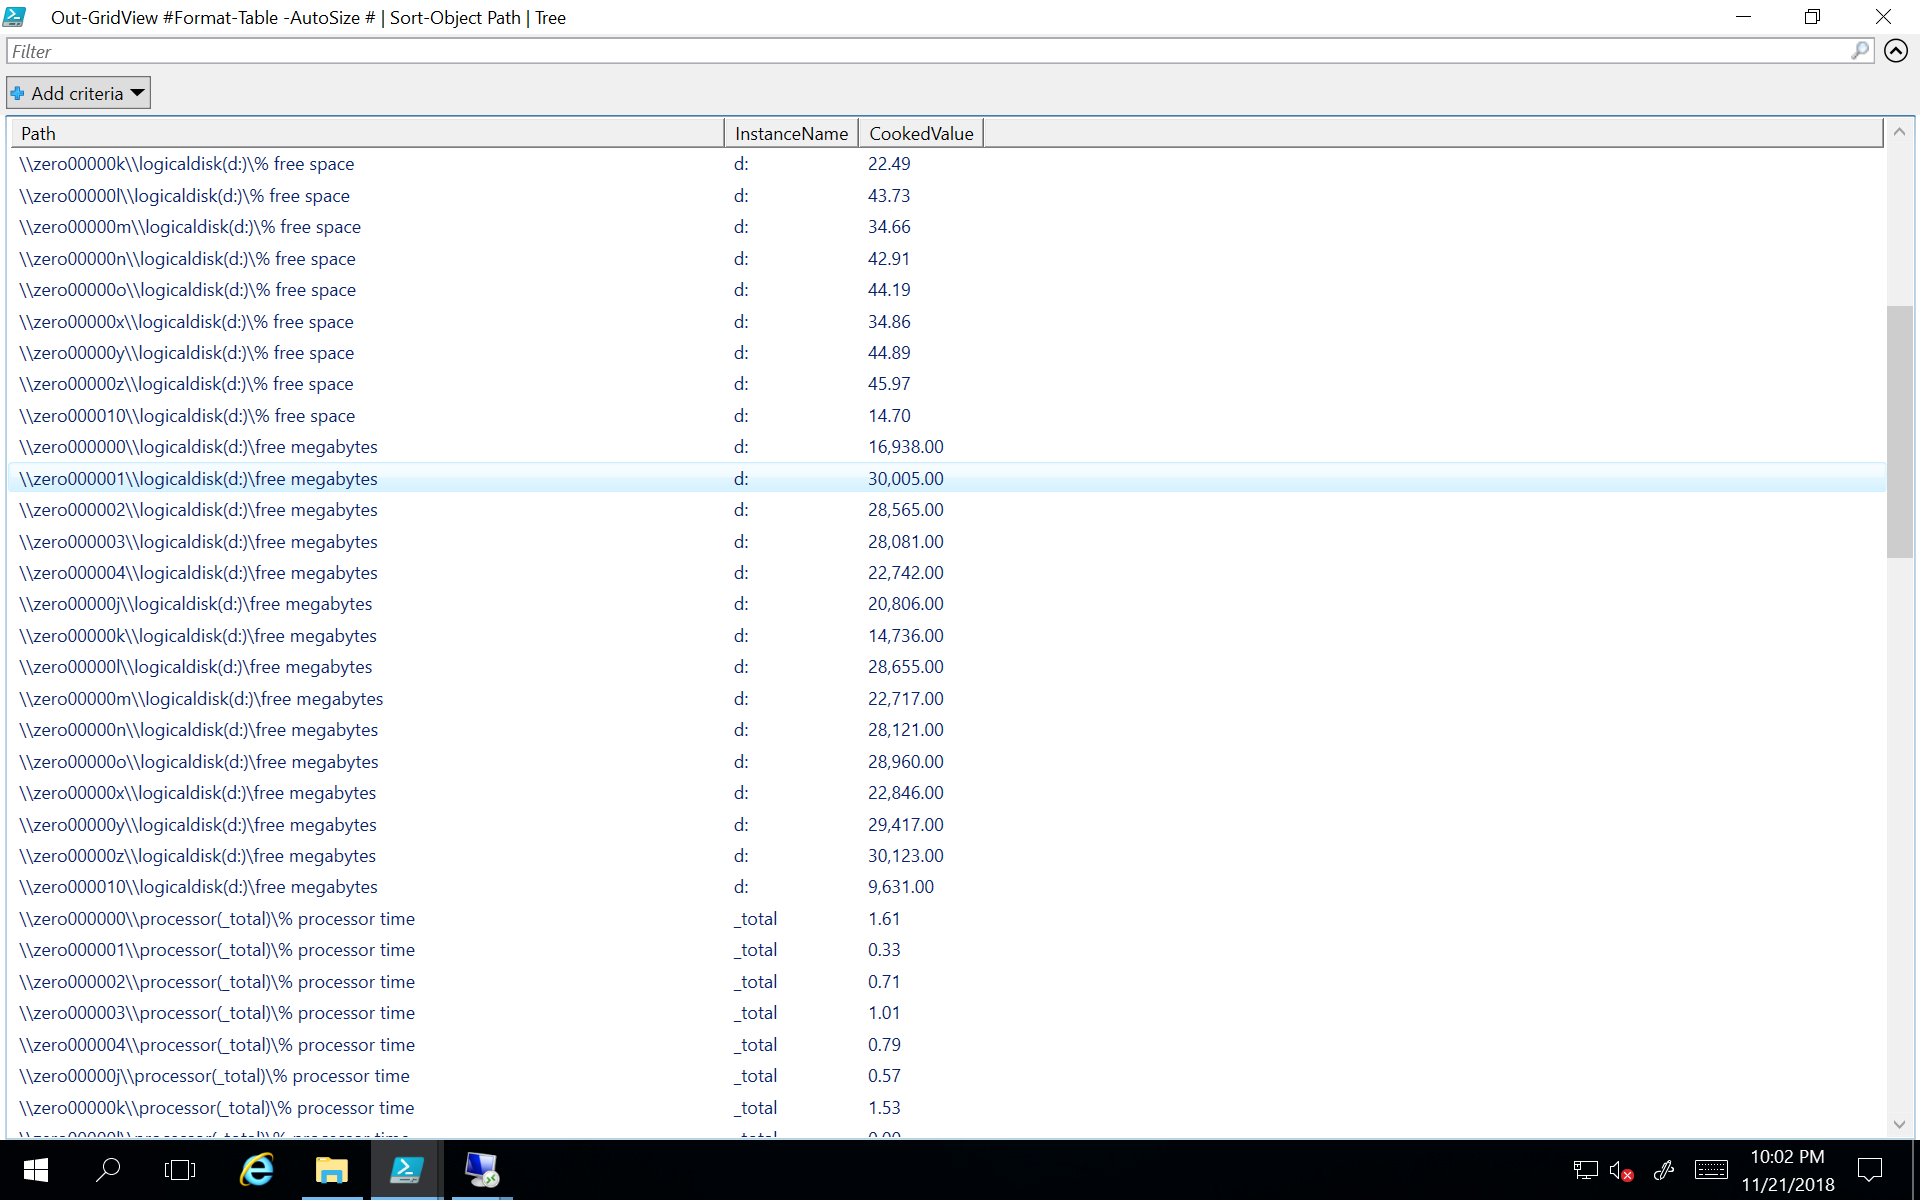
Which displays following.

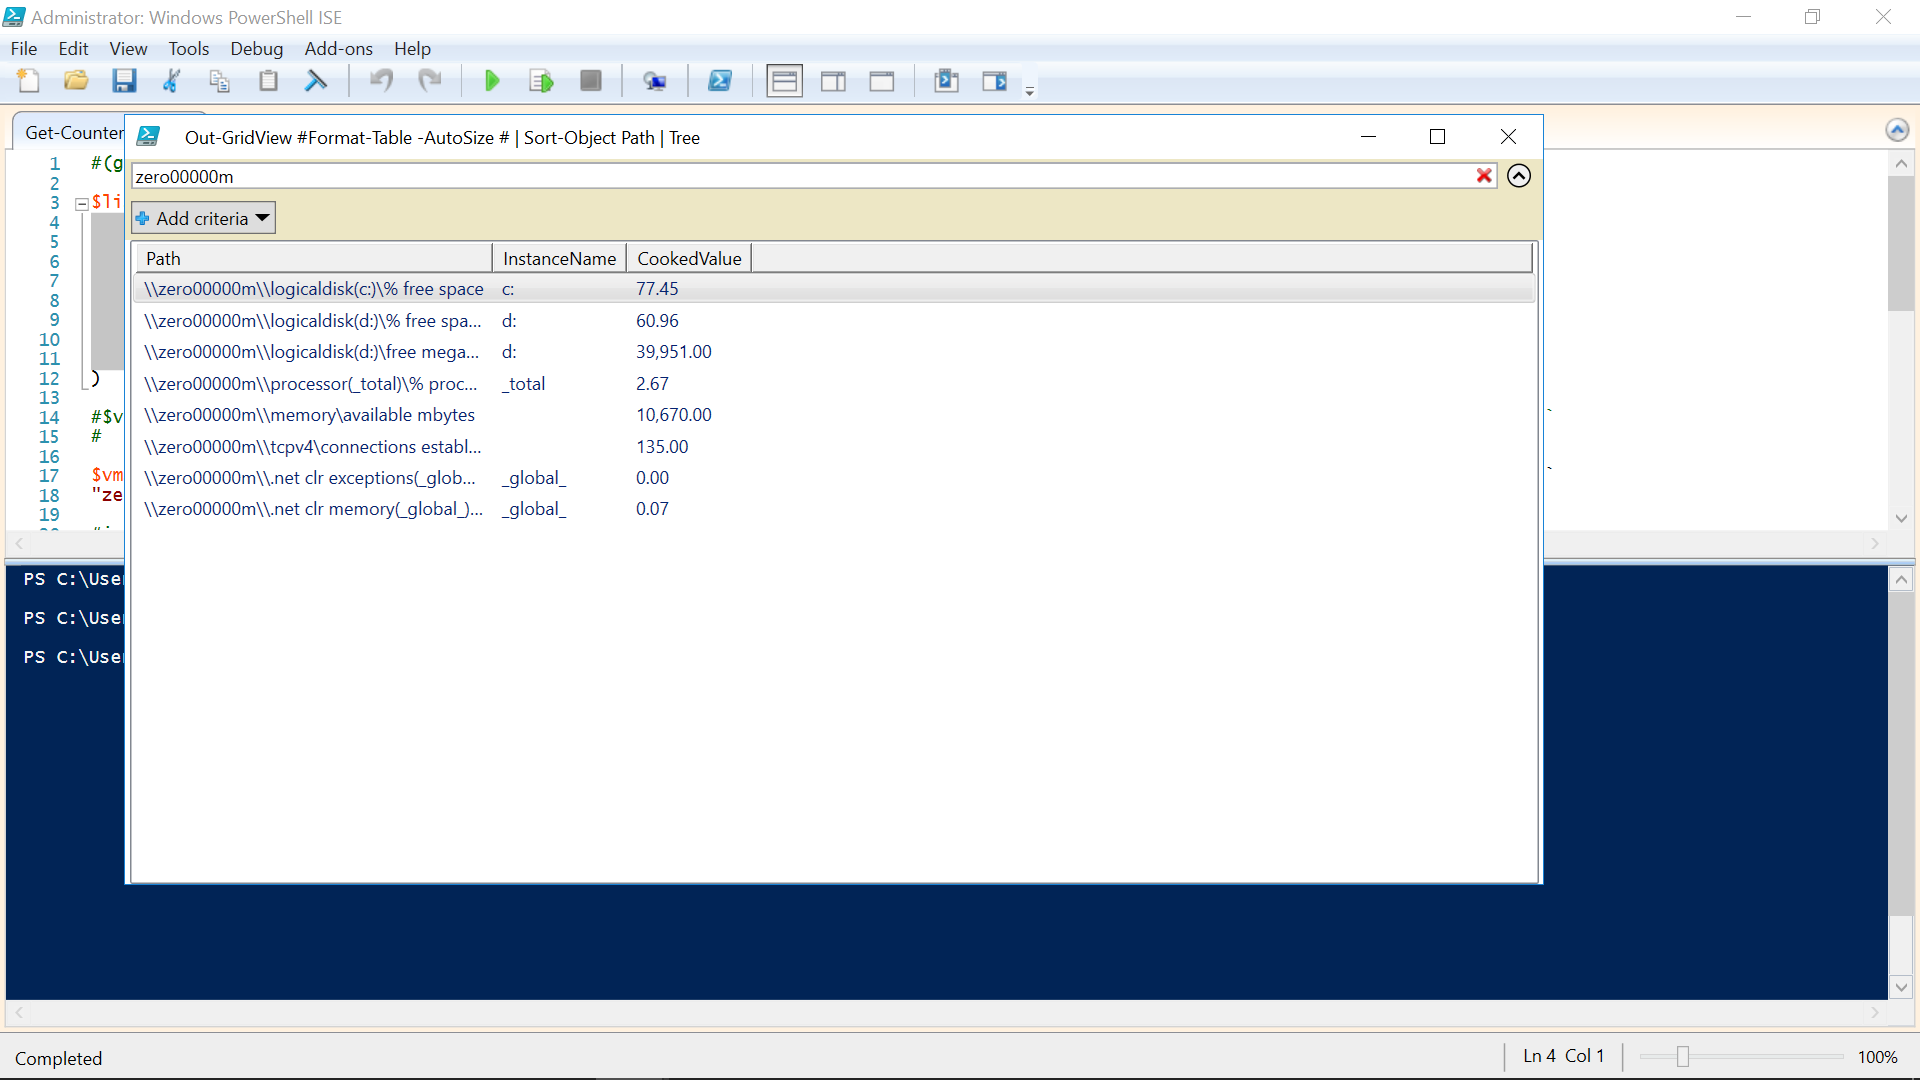
And with the PowerShell grid, it is easy to sort and filter (for example by machine name below).

Keep in mind that this results are a snapshot. To update run the script again.

0 comments