Windows PowerShell 4.0 includes two major enhancements to the script debugger. First, script debugging now works in remote sessions. Second, we’ve added debugging support for workflow scripts. This blog article describes the new remote debugging support and a following article will describe the new workflow script debugging.
Remote Script Debugging in Windows PowerShell
Previously, script debugging in Windows PowerShell was limited to scripts running on the local machine. If you tried to set script breakpoints in a remote session it caused an error. Now, in Windows PowerShell 4.0, you can set breakpoints in remote sessions and debug remote running scripts in the console in just the same way you debug local running scripts.
To use remote debugging, both the client and target machines must be running Windows PowerShell 4.0. Also, remote debugging is supported in Windows PowerShell console but not supported in Windows PowerShell ISE. It might be supported in other host programs. Check the program documentation for details.
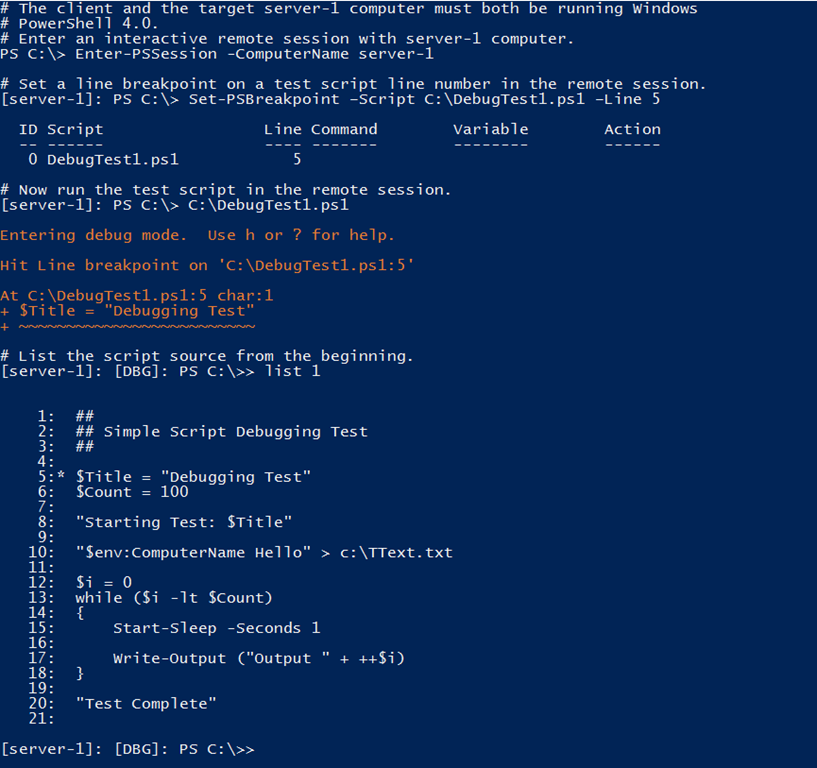
Script debugging in the Windows PowerShell console always begins in the same way. You use the Set-PSBreakpoint cmdlet to set a line, command, or variable breakpoint in a script and then run the script. When the breakpoint is hit, script execution stops and the console transitions into debugger mode. The command prompt changes to indicate that the console is in debug mode and, from this prompt, you can execute debugger commands such as help (‘h’, ‘?’), list source (‘list’, ‘l’), show call stack (‘k’), and execution resume commands (continue, stepInto, stepOut, etc.). You can examine script variables by typing the variable name and even run new commands or script at the debug prompt, all while stopped in the debugger.
Example 1: Console script debugging
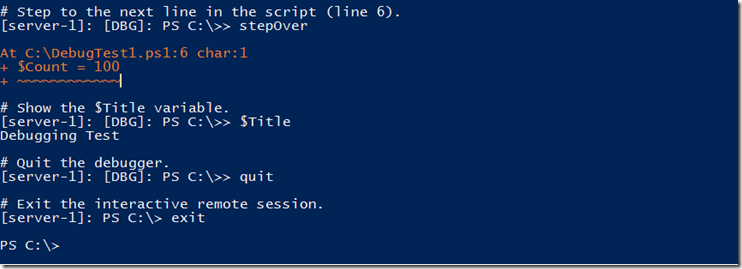
Windows PowerShell remote script debugging provides an almost identical console debugging experience. Since debugging is an interactive endeavor, to debug a script in a remote session, you must first establish an interactive session from which you can debug. This is done by using the Enter-PSSession cmdlet, where you can enter an existing remote session or establish a new one.
Example 2: Create a new remote session and enter into an interactive session with it
There is one significant difference between local script and remote script debugging. When stopped in the debugger during remote script debugging, debug and output data from the remote session arrive at the client through separate and unsynchronized streams. Because we didn’t want the output data to overwrite the prompt or other debugging information, Windows PowerShell suppresses script output data while the debugger is in stop mode. The downside is that some script output might arrive later than expected.
For example, if you step over a statement that generates output, you might not see that output at the next debugger stop. Instead you will see it after you step through one more statement.
Here are a few detailed examples to show you how remote debugging works.
Example 3: Console remote script debugging
Debugging with Disconnected Sessions
Windows PowerShell remote debugging also supports the disconnected and connected session semantics added in Windows PowerShell 3.0. A script debug stop state is preserved in a disconnected session to allow you to debug the script when the connection is re-established.
In Windows PowerShell 3.0, a remote session can be disconnected in one of two ways. The first is a manual disconnect that you initiate by using the Disconnect-PSSession or Invoke-Command -InDisconnectedSession cmdlet. The second is through robust connections auto-disconnect. That is if a network connection is lost in a session that session is automatically disconnected after 4 minutes of trying to re-establish the network connection.
In Windows PowerShell 4.0 there is a third way a remote session is disconnected and that is when you hit a breakpoint in a script in the remote session. In this third case the script in the remote session is stopped in the debugger and the remote session is disconnected from the client. To debug or continue the script, you have to use the Enter-PSSession cmdlet to enter into an interactive debug session from the Windows PowerShell console. In the debug session, you can debug the script or continue execution.
You can determine whether a disconnected session is stopped in the debugger by connecting to it (via Connect-PSSession) and looking at the session Availability field. If it is stopped in the debugger then Availability == ‘RemoteDebug’.
After a remote session is stopped in the debugger and disconnected, you have only two choices about how to proceed with the session. You can debug the session by using the Enter-PSSession cmdlet or you can kill the session by using the Remove-PSSession cmdlet.
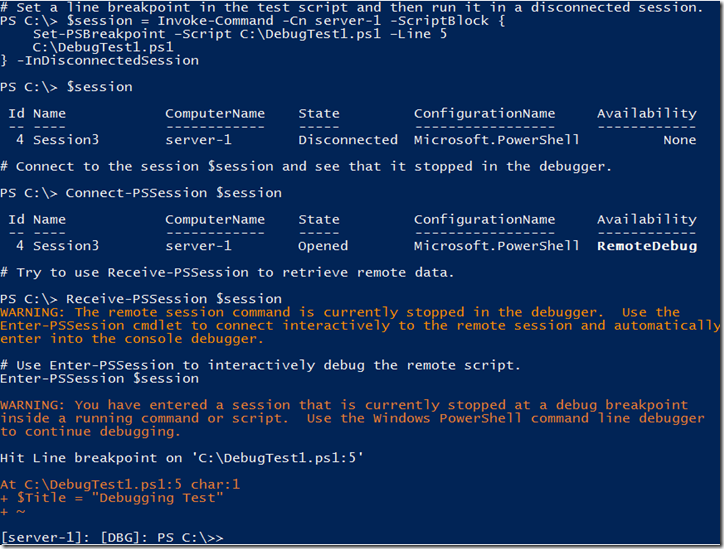
When you run a script in a disconnected session, the script runs on the remote machine and the output data is buffered on the remote machine. You normally connect and retrieve the script output by running Receive-PSSession cmdlet. However, if the script is stopped in the remote session at a breakpoint in the debugger, Receive-PSSession will not work and you will receive a warning message that the session is stopped in the debugger. To continue you must debug the remote script in an interactive session by using Enter-PSSession. In this interactive session you can debug the script or let the script run to completion by removing all breakpoints and using the debugger “continue” command.
Example 4: Debugging a disconnected session
Debugging Remote Sessions with Invoke-Command
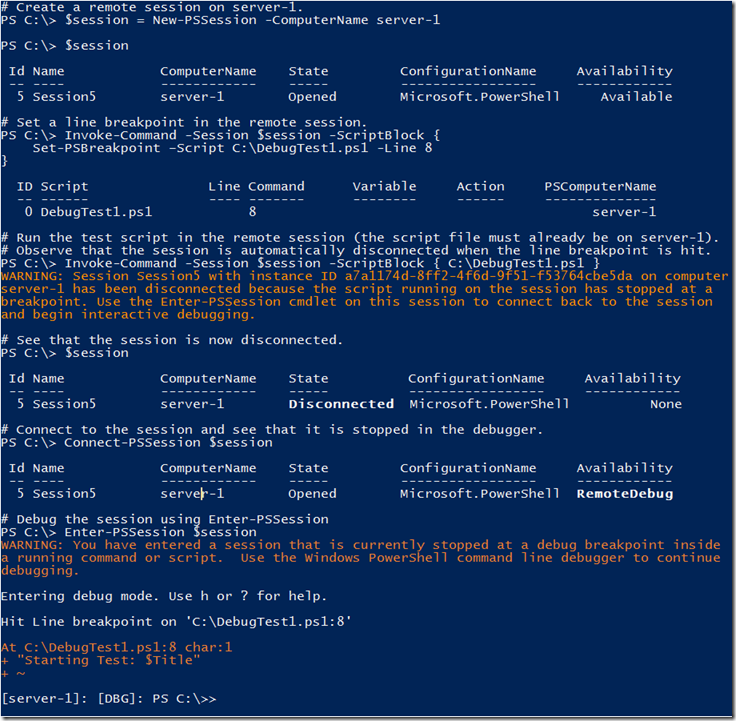
Windows PowerShell supports running scripts synchronously on remote machines by using the Invoke-Command cmdlet. In the section above I talked about using Invoke-Command to set line breakpoints and run script files on a remote machine using the InDisconnectedSession parameter. As you saw, Invoke-Command immediately disconnected the session and let the script run asynchronously in the remote session. You then debugged the remote session using Enter-PSSession. In this scenario we do the same thing except that we leave the session connected while the script is running. When the line breakpoint we set is hit, the session is automatically disconnected. We then connect to the remote session again and debug as before.
Example 5: Debugging a disconnected session, part 2
Debugging remote running scripts is an important and powerful extension of PowerShell script debugging. No longer do you need to copy script files from a remote machine to your local machine just so you can debug them. Now you can debug script right on the remote machine and in that context.
Paul Higinbotham [MSFT] Windows PowerShell Development


0 comments