
This is the fourth in a series of blogs discussing the new PowerShell 5.0 script debugging features. These new features are available through the PowerShell 5.0 preview, which is part of the WMF (Windows Management Foundation) 5.0 preview that you can get from HERE.
In my last article I talked about the Debug-Job command. In this blog I will discuss Runspace debugging which is similar to debugging a job. Runspace debugging is an advanced activity, but is incredibly useful in the right circumstances.
A Runspace is an instance of the PowerShell engine within a process. It defines the context in which a PowerShell command or script runs and contains state that is specific to your PowerShell session, including variables and functions that you define, modules that you load, etc. Normally your ISE or console has a single (default) Runspace, but you can have more than one. Multiple Runspaces let you run scripts concurrently; this has been true since PowerShell version 1 as can be seen in this example: Jim Truher’s Blog (2006).
The PowerShell console and ISE (Integrated Script Environment) create a default Runspace for you. You can see all Runspaces by using the new Get-Runspace cmdlet.
Get-Runspace
Get-Runspace lists all Runspaces in the current process (and AppDomain, but I’ll discuss that in a later blog).
PS C:\> Get-Runspace
Id Name ComputerName Type State Availability
— —- ———— —- —– ————
1 Runspace1 localhost Local Opened Busy
Debug-Runspace
The PowerShell console or ISE script debugger only works on the default Runspace. So how do you debug script in alternate Runspaces?
Debug-Runspace lets you connect the debugger to another Runspace.
Example: Creating and debugging alternate Runspaces
In this example I will show you how to create another Runspace in your PowerShell session, run a script file concurrently in it, and then debug that running script with the ISE debugger. You create a Runspace using the PowerShell API. Jim Truher’s blog shown above also uses the API to create and use Runspaces. What I will show here is the minimum needed. But if you would like more information take a look at these two blogs:
PS C:\> $rs = [runspacefactory]::CreateRunspace()
PS C:\> $rs.Name = “MyRunspace”
PS C:\> $rs.Open()
PS C:\> Get-Runspace
Id Name ComputerName Type State Availability
— —- ———— —- —– ————
1 Runspace1 localhost Local Opened Busy
2 MyRunspace localhost Local Opened Available
PS C:\> $ps = [powershell]::Create()
PS C:\> $ps.Runspace = $rs
PS C:\> $ps.AddScript(‘C:\TestScript.ps1’) > $null
PS C:\> $async = $ps.BeginInvoke()
PS C:\> Get-Runspace
Id Name ComputerName Type State Availability
— —- ———— —- —– ————
1 Runspace1 localhost Local Opened Busy
2 MyRunspace localhost Local Opened Busy
When we now run Get-Runspace we see that the MyRunspace Availability is “busy”, meaning that it is running the test script file.
Finally we debug this running script by using Debug-Runspace to attach the ISE debugger to its Runspace.
PS C:\> Debug-Runspace MyRunspace
Debugging Runspace: MyRunspace
To end the debugging session type the ‘Detach’ command at the debugger prompt, or type ‘Ctrl+C’ otherwise.
[DBG]: [Process:13332]: [MyRunspace]: PS C:\>>
Notice the message you get when running Debug-Runspace. Debug-Runspace attaches your PowerShell console or ISE script debugger to the specified Runspace. If that Runspace is idle and not running any script then Debug-Runspace waits for script to start running at which time it will stop the script in the debugger. You can quit the Debug-Runspace command and detach the debugger by typing Ctrl+C.
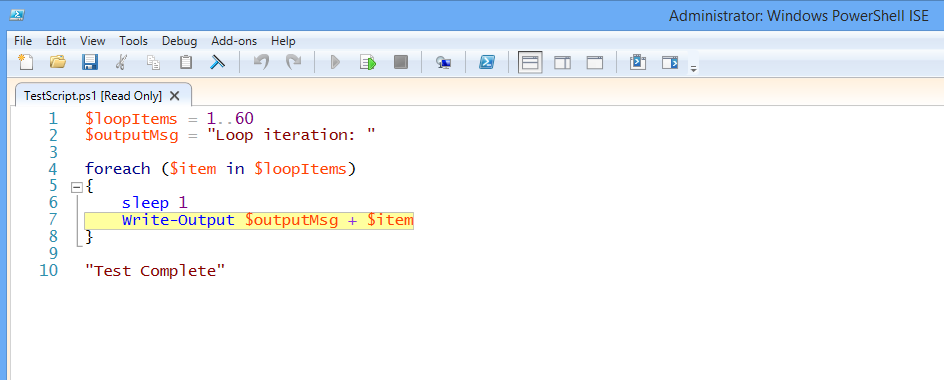
Since the Runspace is busy running script, attaching the debugger also stops the script inside the debugger in step mode. The TestScript.ps1 script file is opened in the ISE and you can now debug the script just as if it was running in the ISE.
When you are done debugging the script you can use the debugger command ‘quit’ to stop the script and detach the debugger. Or you can use the ‘detach’ command to just detach the debugger and let the script continue to run. I have chosen to detach the debugger.
[DBG]: [Process:13332]: [MyRunspace]: PS C:\>> detach
PS C:\>
In this article I showed you how to view and debug Runspaces. But how would you view and debug a Runspace running in a different process? And what if the Runspace you want to debug is running on a different machine? In my next blog I will show you how to do this using the new Enter-PSHostProcess cmdlet.
Paul Higinbotham [MSFT]
Senior Software Engineer
PowerShell Core
0 comments