This is the third of a series of blogs discussing the new PowerShell 5.0 script debugging features. These new features are available through the PowerShell 5.0 preview, which is part of the WMF (Windows Management Foundation) 5.0 preview that you can get from HERE.
In my first article I talked about the script debugger Break All command. Here I will discuss the new Debug-Job Cmdlet. In a way the Debug-Job Cmdlet is really just a Break All command for PowerShell jobs. Recall that jobs are PowerShell’s way to run script asynchronously. Normally you don’t run scripts as jobs but instead run them in the PowerShell console or ISE (Integrated Script Environment) interactively so you can see output as the script runs. The drawback to this is that you have to wait for the script to complete before you can continue typing commands in the console. But jobs let you run script independently and have the script output saved for later viewing. PowerShell can run jobs in a separate local background process (background jobs), on remote machines (remote jobs), and within a Windows Workflow context (workflow jobs). The Debug-Job Cmdlet lets you break into the script debugger with a running job in much the same way the Break All command
lets you break into running script from the console or ISE.
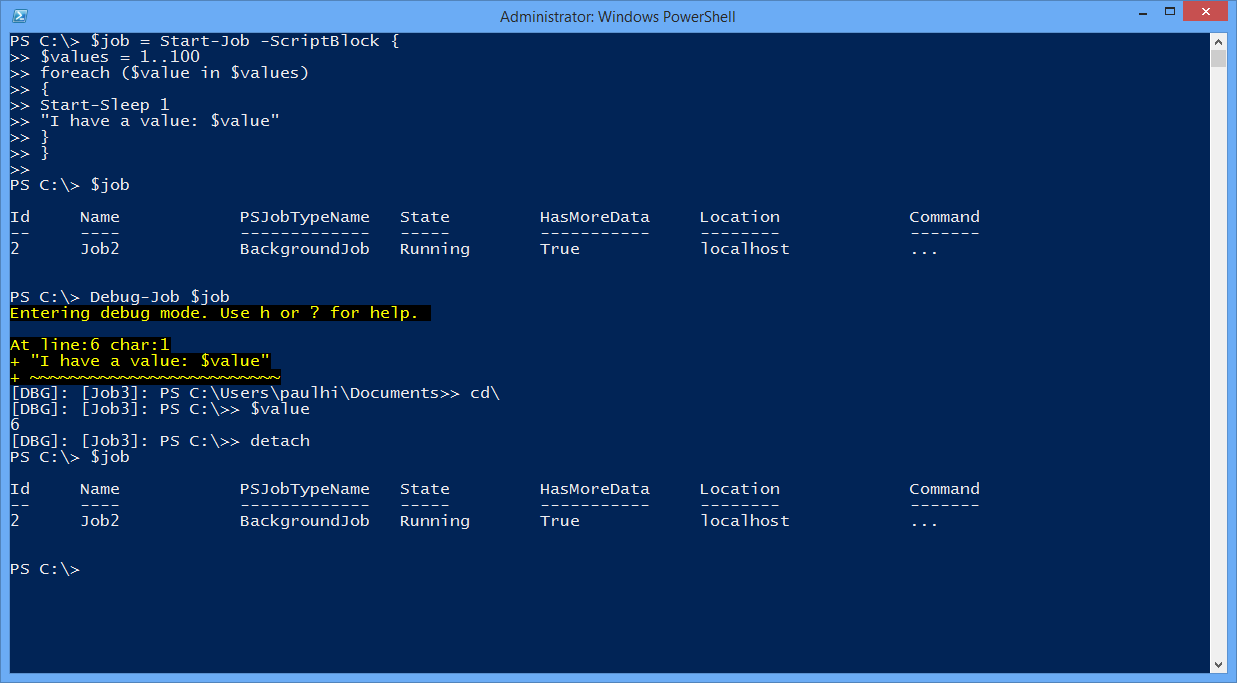
A key scenario where you would use Debug-Job is when you are running a long, complex script as a job and for one reason or another you suspect the script is not executing correctly. It may be taking longer than expected or some of the output data doesn’t seem right. Now you can drop the job into the debugger by using the Debug-Job Cmdlet. Like the Break All command this works both for the PowerShell console and the ISE. It also works over remote PowerShell sessions.
Notice that in the example above I use the new debugger “detach” command to detach the debugger from the job and let it continue running.
Another scenario may be that you want to debug script while running as a job. Normally you would debug the script in an interactive console or ISE session before running it as a job, but there may be times when you need to debug the script as it runs in a job context because that is the only time the script fails. In this case you can set breakpoints and/or use the new Wait-Debugger Cmdlet.
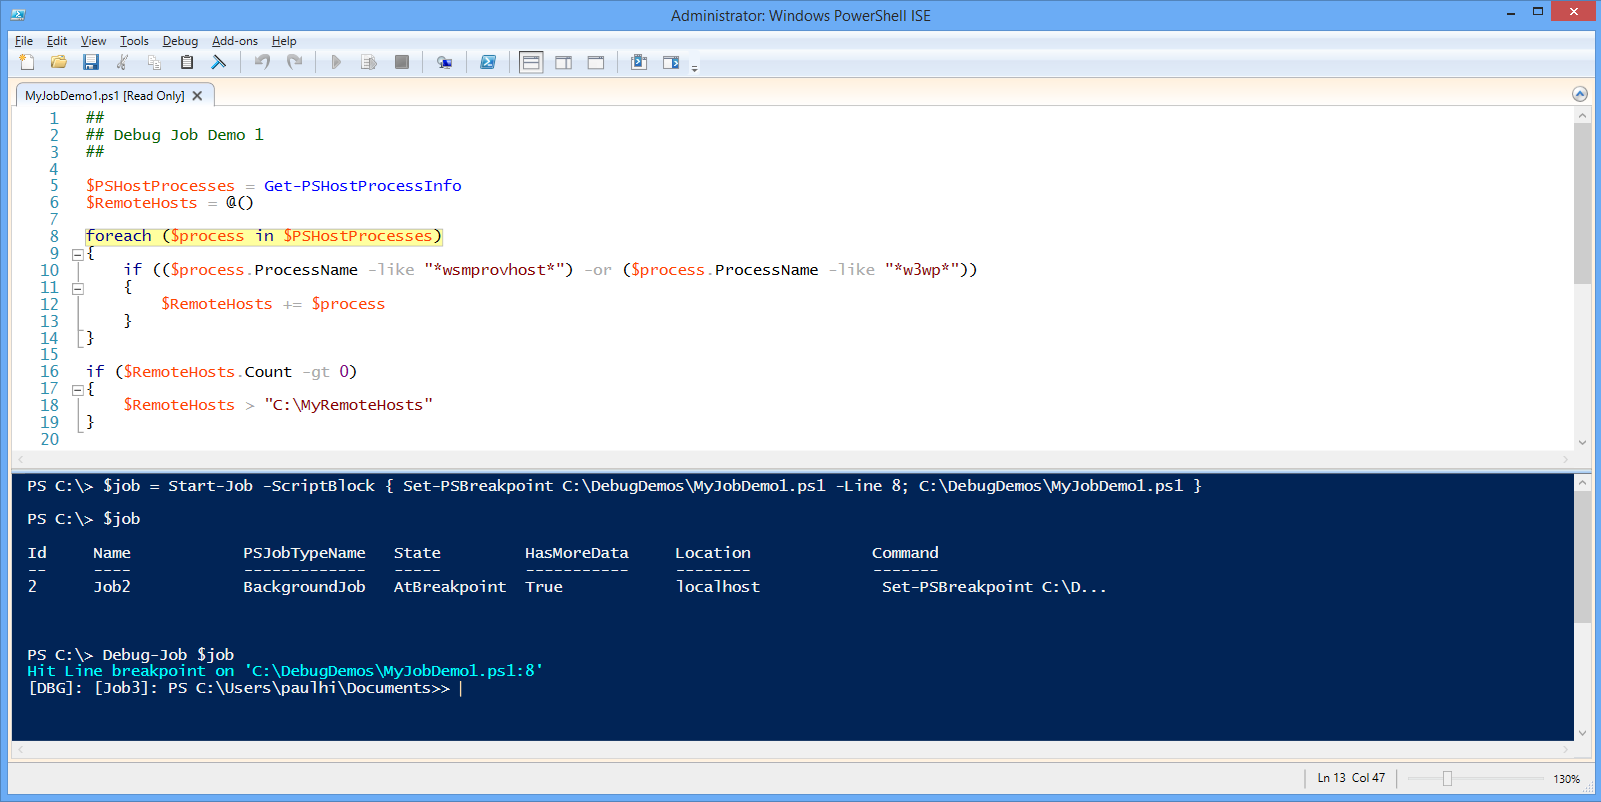
In this example I use Start-Job and in the script block I first set a breakpoint at line 8 in a script file I want to run and then run the script file.
PS C:\> $job = Start-Job -ScriptBlock { Set-PSBreakpoint C:\DebugDemos\MyJobDemo1.ps1 -Line 8; C:\DebugDemos\MyJobDemo1.ps1 }
PS C:\> $job
PS C:\> Debug-Job $job
We see from the job information above that its job state is “AtBreakpoint” indicating that the job is stopped at a breakpoint and is waiting to be debugged. You then use the Debug-Job cmdlet to attach the ISE debugger to the job and debug the job script beginning at line 8 in the script file.
NOTE: As mentioned in previous articles, the PowerShell script debugger only works when the job script is running, i.e., when script statements and expressions are being executed. If the script is calling an external command (such as Restart-Service) and that command does not return then the script debugger is not effective. In this case you need to use a native/managed code debugger to investigate the problem.
One interesting thing about debugging PowerShell jobs is that jobs are designed to run non-interactively and debugging is an inherently user interactive process. The PowerShell console and ISE have built-in debugging support and so when you debug script you automatically invoke those built-in debuggers. But jobs run independently and there is no debugger available. So what the Debug-Job Cmdlet does is attach or redirect the console or ISE debugger (depending on whether you run the Cmdlet in the console or ISE) temporarily to the job. You then debug the running job script just as if it were running interactively in the console or ISE. So there is a new concept of “debugger attach” and “debugger detach”. Attaching the debugger redirects the console/ISE debugger to the job and detaching the debugger reverses this process. When you are done debugging job script you can do two things. You can quit the debugger and this ends debugging while stopping the running job. Or you can detach the debugger from the job and let the job script continue to run.
Again we use the “detach” debugger command at the debug prompt to stop debugging the job and let it continue to run. When we view the job information we see that the job state shows it has completed.
Debugging PowerShell jobs is an advanced debugging feature. It is not something you would need to do on a regular basis, but can come in very handy for some scenarios. My next article will continue along these lines with another advanced debugging feature that lets you list individual PowerShell runspaces and debug them. And yes I will spend some time describing what a runspace is and why you might want to debug one.
Paul Higinbotham [MSFT]
Windows PowerShell Development


0 comments