
Introduction
xDscDiagnostics is a PowerShell module that consists of two simple operations that can help analyze DSC failures on your machine – Get–xDscOperation and Trace-xDscOperation. These functions help in identifying all the events from past DSC operations run in your system, or any other computer (Note: you need a valid credential to access remote computers). Here, we use the term DSC Operation to define a single unique DSC execution from its start to its end. For instance, Test-DscConfiguration would be a separate DSC Operation. Similarly, every other cmdlet in DSC (such as Get-DscConfiguration, Start-DscConfiguration, etc.) could each be identified as a separate DSC operation.
The two cmdlets are explained here and in more detail below. Help regarding the cmdlets are available when you run get-help <cmdlet name>.
Get-xDscOperation
This cmdlet lets you find the results of the DSC operations that run on one or multiple computers, and returns an object that contains the collection of events produced by each DSC operation.
For instance, in the following output, we ran three commands, the first of which passed, and the others failed. These results are summarized in the output of Get-xDscOperation.

Figure 1 : Get-xDscOperation that shows a simple output for a list of operations executed in a machine
Parameters
-
Newest – Accepts an integer value to indicate the number of operations to be displayed. By default, it returns 10 newest operations. For instance,
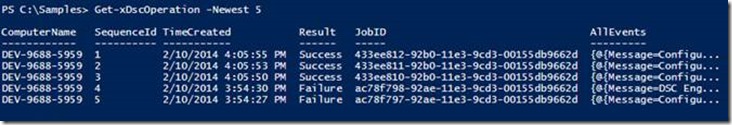
Figure 2 : Get-xDscOperation can display the last 5 operations’ event logs
-
ComputerName – Parameter that accepts an array of strings, each containing the name of a computer from where you’d like to collect DSC event log data. By default, it collects data from the host machine. To enable this feature, you must run the following command in the remote machines, in elevated mode so that the will allow collection of events
New-NetFirewallRule -Name “Service RemoteAdmin” -Action Allow
-
Credential – Parameter that is of type PSCredential, which can help access to the computers specified in the ComputerName parameter.
Returned object
The cmdlet returns an array of objects each of type Microsoft.PowerShell.xDscDiagnostics.GroupedEvents. Each object in this array pertains to a different DSC operation. The default display for this object has the following properties:
-
SequenceID: Specifies the incremental number assigned to the DSC operation based on time. For instance, the last executed operation would have SequenceID as 1, the second to last DSC operation would have the sequence ID of 2, and so on. This number is another identifier for each object in the returned array.
-
TimeCreated: This is a DateTime value that indicates when the DSC operation had begun.
-
ComputerName: The computer name from where the results are being aggregated.
-
Result: This is a string value with value “Failure” or “Success” that indicates if that DSC operation had an error or not, respectively.
-
AllEvents: This is an object that represents a collection of events emitted from that DSC operation.
For instance, if you’d like to aggregate results of the last operation from multiple computers, we have the following output:

Figure 3 : Get-xDscOperation can display logs from many other computers at once.
Trace-xDscOperation
This cmdlet returns an object containing a collection of events, their event types, and the messages output generated from a particular DSC operation. Typically, when you find a failure in any of the operations using Get-xDscOperation, you would want to trace that operation to find out which of the events caused a failure.
Parameters
-
SequenceID: This is the integer value assigned to any operation, pertaining to a specific computer. By specifying a sequence ID of say, 4, the trace for the DSC operation that was 4th from the last will be output

Figure 4: Trace-xDscOperation with sequence ID specified
-
JobID: This is the GUID value assigned by LCM xDscOperation to uniquely identify an operation. Hence, when a JobID is specified, the trace of the corresponding DSC operation is output.

Figure 5: Trace-xDscOperation taking JobID as a parameter – to output the same record as above – they just have two identifiers- job id and SequenceID
-
Computer Name and Credential: These parameters allow the trace to be collected from remote is necessary to run the command :
New-NetFirewallRule -Name “Service RemoteAdmin” -Action Allow

Figure 6: Trace-xDscOperation running on a different computer with the -ComputerName option
Note: Since Trace-xDscOperation would aggregate events from Analytic, Debug, and operational logs, it will prompt the user to enable these logs. If the logs are not enabled, an error message is displayed stating that these events cannot be read until it has been enabled. However, the trace from other logs are still displayed. This error can be ignored.
Returned object
The cmdlet returns an array of objects, each of type Microsoft.PowerShell.xDscDiagnostics.TraceOutput. Each object in this array contains the following fields:
-
ComputerName: The name of the computer from where the logs are being collected.
-
EventType: This is an enumerator type field that contains information on the type of event. It could be any of the following :
a. Operational : Indicates the event is from the operational log
b. Analytic : The event is from the analytic log
c. Debug : This would mean the event is from the debug log
d. Verbose: These events are output as verbose messages during execution. The verbose messages make it easy to identify the sequence of events that are published.
e. Error: These events are error events. Please note that by looking for the error events, we can immediately find the reason for failure most of the times.
-
TimeCreated : A DateTime value indicating when the event was logged by DSC
-
Message: The message that was logged by DSC into the event logs.
There are some fields in this object that are not displayed by default, which can be used for more information about the event. These are:
-
JobID : The job ID (GUID format) specific to that DSC operation
-
SequenceID: The SequenceID unique to that DSC operation in that computer.
-
Event: This is the actual event logged by DSC, of type System.Diagnostics.Eventing.Reader.EventLogRecord. This can also the obtained from running the cmdlet Get-Winevent, as in the blog here. It contains more information such as the task, eventID, level, etc. of the event.
Hence, we could obtain information on the events too, if we saved the output of Trace-xDscOperation into a variable. To display all the events for a particular DSC operation, the following command would suffice:
(Trace-xDscOperation-SequenceID3).Event
That would display the same result as the Get-Winevent cmdlet, such as in the output below.

Figure 7 : Output that is identical to a get-winevent output. These details can be extracted using the xDscDiagnostics module as well
Ideally, you would first want to use Get-xDscOperations to list out the last few DSC configuration runs on your machines. Following this, you can dissect any one single operation (using its sequenceID or JobID) with Trace-xDscOperation to find out what it did behind the scenes.
In summary, xDscDiagnostics is a simple tool to extract the relevant information from DSC logs so that the user can diagnose operations across multiple machines easily. We urge the users to use this more often to simplify their experience with DSC.
Inchara Shivalingaiah Software Developer Windows PowerShell Team
0 comments