
Starting with the 2505.09 release of PIX on Windows, new metrics have been added to help you optimize your title on battery powered devices such as tablets and Windows handheld gaming devices. With these counters, you can see whether performance issues in your game can be correlated with power-related events, such as a change in CPU C-state, or a device going into power saving mode, for example.
These metrics are available in System Monitor, and in the Metrics, Comparison, and Budgets layouts in Timing Captures. The following metrics are provided:
System Power Status Metrics
- AC Power Status. Indicates whether AC power is plugged in. A value of 1 indicates power is plugged in. A value of 0 indicates power is not plugged in.
- Battery Life Percentage. A value of 0-100 indicating the current percentage of batter life remaining.
- Battery Saver Status. Indicates whether the device is in battery saving mode. Game performance will be impacted when a device is in this mode, as the system will limit the availability of resources to conserve power. A value of 1 indicates battery saver is on. A value of 0 indicates battery saver is not on.
Per-Processor Metrics
- CPU C-State. The current C-State, or Idle State, of the processor. There will be one of these metrics for each processor on the device. The C-State metric indicates states when the CPU has reduced or turned off selected functions to conserve power. Game performance can be impacted by these C-States because it takes longer for the processor to switch to C0 which is the only c-state where code is executing.
- CPU Max C-State. The maximum value for C-State. There will be one of these metrics per processor on the device. The CPU Max C-State provides context when looking at the current C-State.
- CPU Frequency. The current frequency in Mhz of the processor. There will be one of these metrics per processor on the device. Higher frequency means more power consumption and faster performance.
- CPU Max Frequency. The maximum frequency value to serve as a comparison when looking at the current frequency. There will be one of these metrics per processor on the device.
More information about C-States can be found at P-states and C-states.
Timing Captures
The System Power Status and Per-Processor metrics appear in Timing Captures in the Metrics selector panels in the Metrics, Budget and Comparison layouts.

As a simple example of these metrics, the following Metrics view graph shows how CPU frequency (represented by the green line) can vary based on whether the device is plugged into AC power or not (represented by the red line).
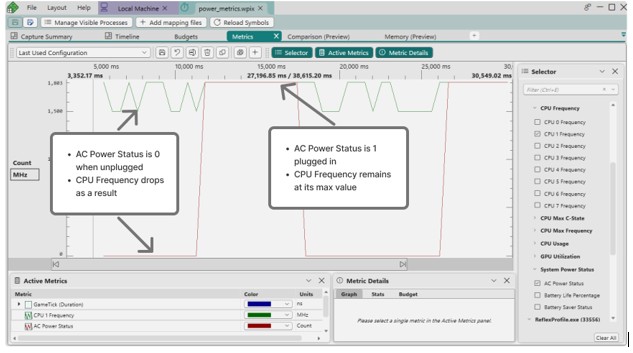
Graphing the PIX CPU event that represents a frame in my game (represented by the blue line) over these power counters shows some interesting correlations. First, there are significant spikes in frame time both when the power is unplugged and then plugged in again. Second, the average frame time appears lower when running on battery power than when running on AC power.
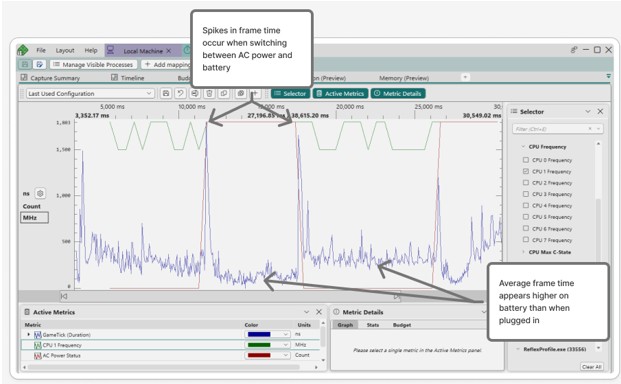
Selecting a time range when the power is unplugged shows an average frame time of ~47ms.

Selecting a range of time when AC power is plugged in shows a faster average frame time of ~29ms.

The Comparison layout can be used to get more detail about the differences. The following shows a statistical analysis of the difference in frame times for the AC and the battery cases.

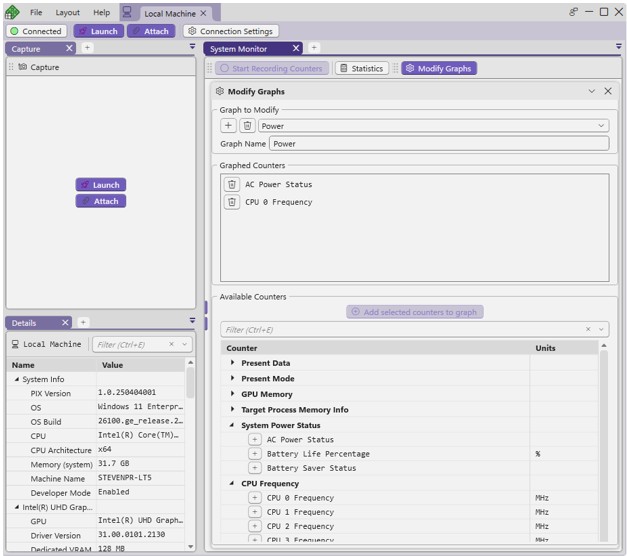
System Monitor
The system power status and per-processor metrics are available in System Monitor, but they aren’t graphed by default. Use the Modify Graphs button to add a new graph with these metrics or to add them to an existing graph.
0 comments