
Hardware Counters in GPU Captures
Contents
- Supported Hardware
- Intro: Hardware Counters in GPU Captures
- AMD Counters
- Intel Occupancy Graphs
- NVIDIA Counter Acronyms/Terms
Supported Hardware
| Timing Analysis | Event List Counters | High Frequency Counters | |
| AMD | ✓ | ✓ | ✓ |
| Intel | ✓ | ✓ | ✓ |
| NVIDIA | ✓ | ✓ | ✓ (on NVIDIA Turing and Ampere architectures) |
Intro: Hardware Counters in GPU Captures
GPU Captures in PIX on Windows support collecting hardware-specific counters on AMD, Intel, and NVIDIA GPUs. There are several PIX features that will show hardware counter values to you in different ways. See below for details.
Each hardware vendor chooses which counters they support in PIX. If you would like PIX to support more hardware counters, then please contact us and/or your representative at the appropriate hardware vendor.
Event List Counters
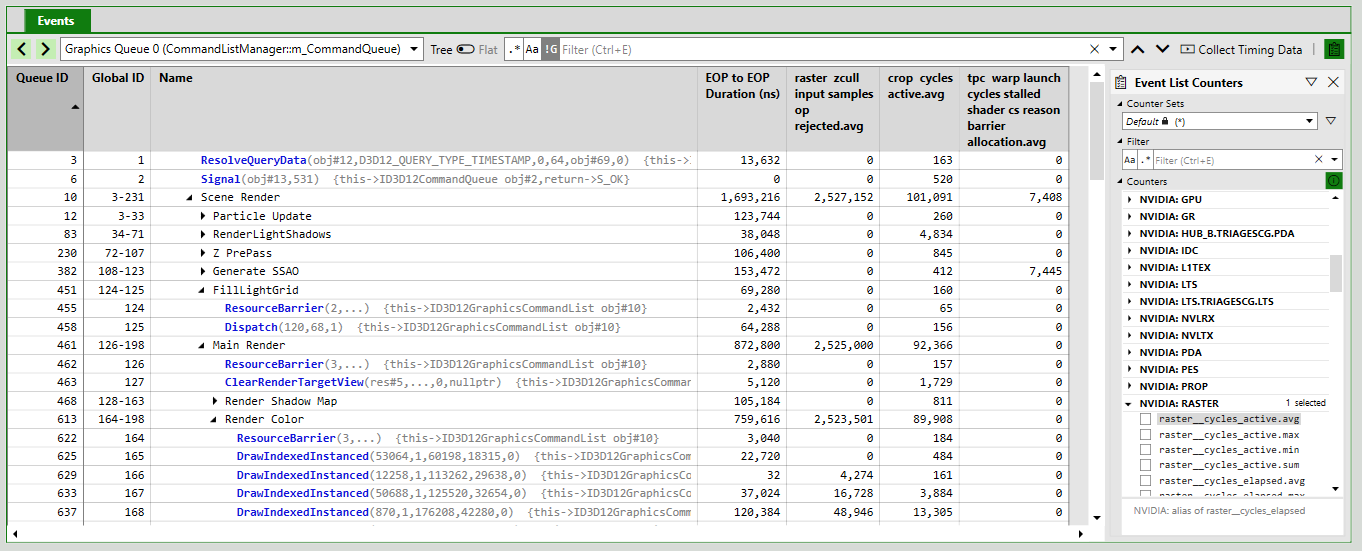
In the Event List view, you can click on the clipboard icon in the top-right corner of the view to open the counter selection panel. In this panel, you can choose individual counters that you would like to collect. After selecting a counter and collecting timing data, PIX will display a value for the counter next to each event:
 (click image to enlarge)
PIX will also show counter values for each PIX marker region defined in the original application via WinPixEventRuntime APIs such as PIXBeginEvent(). These “rolled up” values might not necessarily be the sum or average of the counter values of individual events within the marker region though. Instead, PIX performs repeated playbacks (“rounds”) to recollect the counters at each level in the PIX marker hierarchy.
You can click on a counter to view more information about it:
High Frequency Counters
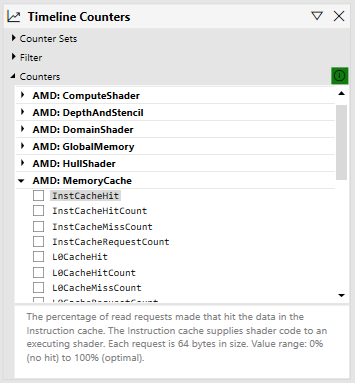
In the Timeline view, you can click on the counter graph icon (or the “Show Counter” link) to open the Timeline counter selection panel. After selecting some counters and collecting timing data, PIX will display graphs of the selected counters’ values over time:
 (click image to enlarge)
When possible, PIX will collect the selected counters together during a single playback. However, this may not be possible due to hardware limitations, so PIX will collect counters during separate playbacks if necessary.
The counters available in the Timeline view are often similar to the counters available in the Event List view, but they may not be identical. Certain counters may make sense, or may only be technically possible, in one of the views.
New: Occupancy Graphs
As-of the August 2021 release, the Timeline view on AMD, Intel and NVIDIA will include some predefined counter graphs that together will help you understand your GPU’s occupancy. These new counter graphs are based on the High Frequency Counters described above.
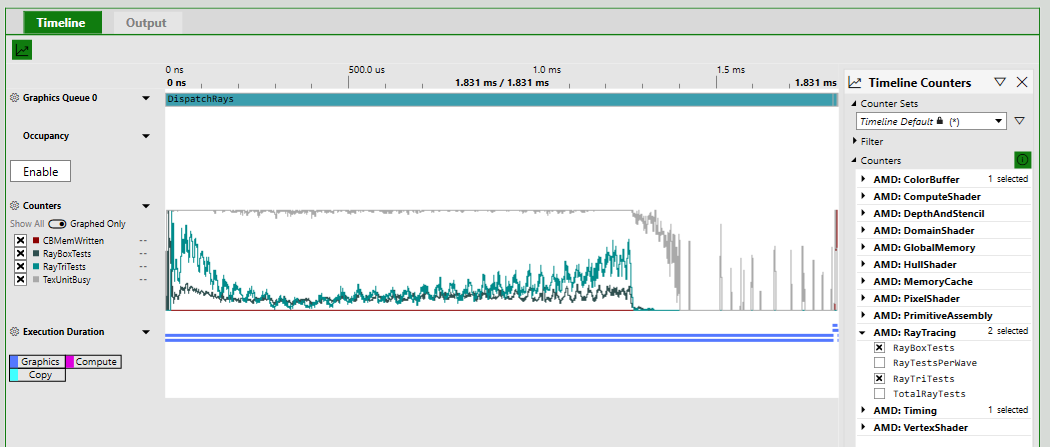
Each graph contains a pre-defined set of counters chosen by the hardware vendor. To view each graph, first collect timing data for your application, and then click “Click here” on the graph. The full timeline will look like this:
 (Screenshot from an Intel GPU. Click image to enlarge)
Old: Occupancy Graph
Since 2018, PIX has also supported a separate Occupancy graph. This will be removed in a future PIX release, in favor of the newer occupancy graphs based on High Frequency Counters above. In the meantime, here is documentation about PIX’s old occupancy graph:
GPUs are usually constructed as a hierarchy of repeated blocks, where each level might share a resource. For example, an imaginary GPU might be structured like this:

GPUs execute shaders by breaking up the shader work into waves (these are also called warps or wave fronts). In the above diagram, each blue block is capable of executing one wave. Each green block could execute up to four waves.
As all the blues share a single set of registers, if a workload needs all the registers then only one wave at a time can execute in the green block. In this case the occupancy of the green block would be 1, out of a total possible occupancy of 4.
At any point in time, all the green blocks may be executing different number of waves. Of the four green blocks above, one might be executing 3 waves, another 2 waves, and the remaining 1 wave. PIX boils all this data down to a single value – the maximum occupancy, which would be 3 in this example.
This is presented in PIX in the Occupancy lane, which shows the maximum occupancy, separated by shader stage. This is an indication of how much work the GPU is able to do in parallel – higher bars show better GPU utilization. Here is an example from a relatively large capture:

Selecting an event will overlay the maximum occupancy for just that event (this example is from a very small capture that has just a couple of draws):
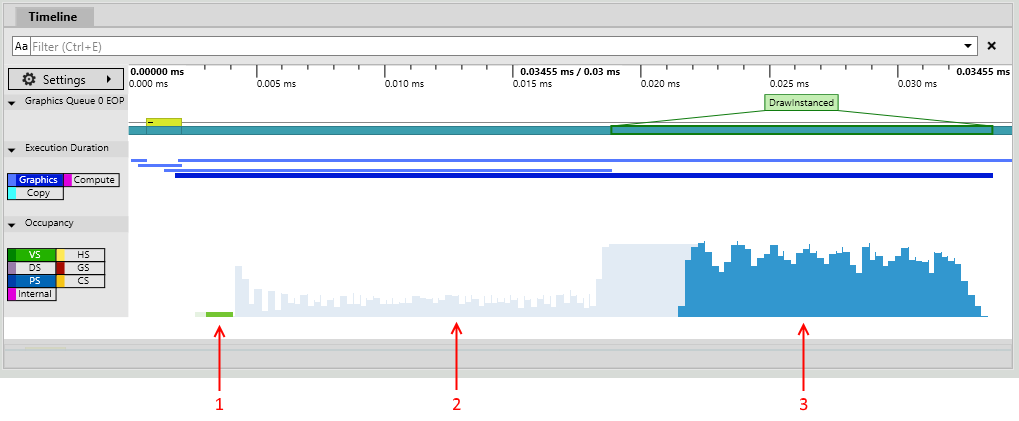
The annotations on this image show:
- Vertex shader work for this event.
- Pixel shader work for events other than this one.
- Pixel shader work for this event.
AMD Counters
To see a helpful description of each counter on AMD, please click on the counter in PIX’s counter selection pane. For documentation about the Wave Distribution and Occupancy Limiter graphs, please continue reading.
Author: Peter Lohrmann, August 2021
The Wave Distribution Graphs are now supported on AMD Radeon RX 5000 and 6000 Series GPUs. The graphs and corresponding counters are specified below, along with the counter descriptions. Below that is some guidance on how to interpret these graphs, how to associate the various wave types to the DirectX12 shader stages, and how to reduce resource usage to improve wave occupancy.
- Wave Distribution
- WaveOccupancyPct – The percentage of the maximum wavefront occupancy that is currently being used.
- Wave Occupancy Limiters
- LSHSLimitedByVgpr – The percentage of LS and HS wave scheduling requests that are limited by VGPR availability.
- LSHSLimitedByLds – The percentage of LS and HS wave scheduling requests that are limited by LDS availability.
- LSHSLimitedByScratch – The percentage of LS and HS wave scheduling requests that are limited by scratch space availability.
- HSLimitedByBarriers – The percentage of HS wave scheduling requests that are limited by barriers.
- ESGSLimitedByVgpr – The percentage of ES and GS wave scheduling requests that are limited by VGPR availability.
- ESGSLimitedByLds – The percentage of ES and GS wave scheduling requests that are limited by LDS availability.
- ESGSLimitedByScratch – The percentage of ES and GS wave scheduling requests that are limited by scratch space availability.
- VSLimitedByVgpr – The percentage of VS wave scheduling requests that are limited by VGPR availability.
- VSLimitedByScratch – The percentage of VS wave scheduling requests that are limited by scratch space availability.
- VSLimitedByExport – The percentage of cycles that VS Waves are stalled due to export space availability.
- PSLimitedByLds – The percentage of PS wave scheduling requests that are limited by LDS availability.
- PSLimitedByVgpr – The percentage of PS wave scheduling requests that are limited by VGPR availability.
- PSLimitedByScratch – The percentage of PS wave scheduling requests that are limited by scratch space availability.
- CSLimitedByLds – The percentage of CS wave scheduling requests that are limited by LDS availability.
- CSLimitedByVgpr – The percentage of CS wave scheduling requests that are limited by VGPR availability.
- CSLimitedByScratch – The percentage of CS wave scheduling requests that are limited by scratch space availability.
- CSLimitedByBarriers – The percentage of CS wave scheduling requests that are limited by barriers.
- CSLimitedByThreadGroupLimit – The percentage of CS wave scheduling requests that are limited by the thread group limit.
Interpreting Wave Distribution and the Wave Occupancy Limiters
Given a sufficient workload to utilize all the wave slots on the hardware, the WaveOccupancyPct counter should be up at 100%. However, the workload may also require the use of certain resources that are of limited availability (VGPRs, LDS, Scratch memory, Barriers, or Export space). As these resources become allocated for scheduled waves, it’s possible that additional waves may not be able to be scheduled due to a lack of resource availability. The Wave Occupancy Limiters graph will indicate which shader types were unable to be scheduled and which resources were causing the limitation.
| Scenario | Probable Cause |
| WaveOccupancyPct = 100% | This is the theoretical ideal case. |
| WaveOccupancyPct < 100% AND one or more Wave Occupancy Limiters graph counters are non-zero. | The non-zero Wave Occupancy Limiters counters indicate the resources which are preventing specific wave types from being scheduled. |
| WaveOccupancyPct < 100% AND none of the Wave Occupancy Limiters graph counters are non-zero. | All of the waves of the workload have been scheduled, and resource availability is no longer a limiting factor. |
Wave Types vs API Shader Types
The various DirectX12 shaders may execute as different wave types depending on the functionality used by pipeline being executed. In particular, the application’s Vertex Shader may be executed as either a VS, ESGS, or LSHS wave type depending primarily on whether Tessellation and/or Geometry shaders are being used.
| AMD Hardware Wave Types | DX12 Shader Types |
| LSHS | Vertex + Hull Shaders (with tessellation only) |
| ESGS | Vertex Shader (sometimes) or Vertex + Geometry Shaders or Domain Shader or Domain + Geometry Shaders |
| VS | Vertex Shader (sometimes) |
| PS | Pixel Shader |
| CS | Compute Shader |
Resources
The resource requirements of a particular shader are influenced by the shader code itself. It may be possible to simplify or restructure the shader or data formats to reduce the resource requirements and improve occupancy. Keep in mind, that improving occupancy does not necessarily correlate directly with improved performance.
| Resource | How to Reduce Limitations |
| VGPR | Vector General Purpose Registers – Reducing vector operations in the shader may reduce VGPR usage. |
| LDS | Local Data Store – Reduce the amount of data that is shared across work items within the wave. |
| Scratch | Scratch Memory – Reduce the number of temporary variables that are used by the shader. |
| Barriers | Barriers – Barriers may be allocated due to the shader specifically needing to synchronize the entire threadgroup, or due to specific instructions. |
| Export | Export Space – Vertex attributes require allocation of export space, and scheduling of VS waves may be limited if the export space is fully allocated. Backpressure from the export space may also prevent additional waves from being scheduled. |
| ThreadGroupLimit | Thread Group Limit – The shader-defined thread group size may not be an even divisor of the thread group limit, and thus may prevent additional threadgroups from being scheduled. This only applies to the Compute Shader. |
Intel: Occupancy Graphs
Author: Stanislav Volkov, April 2021
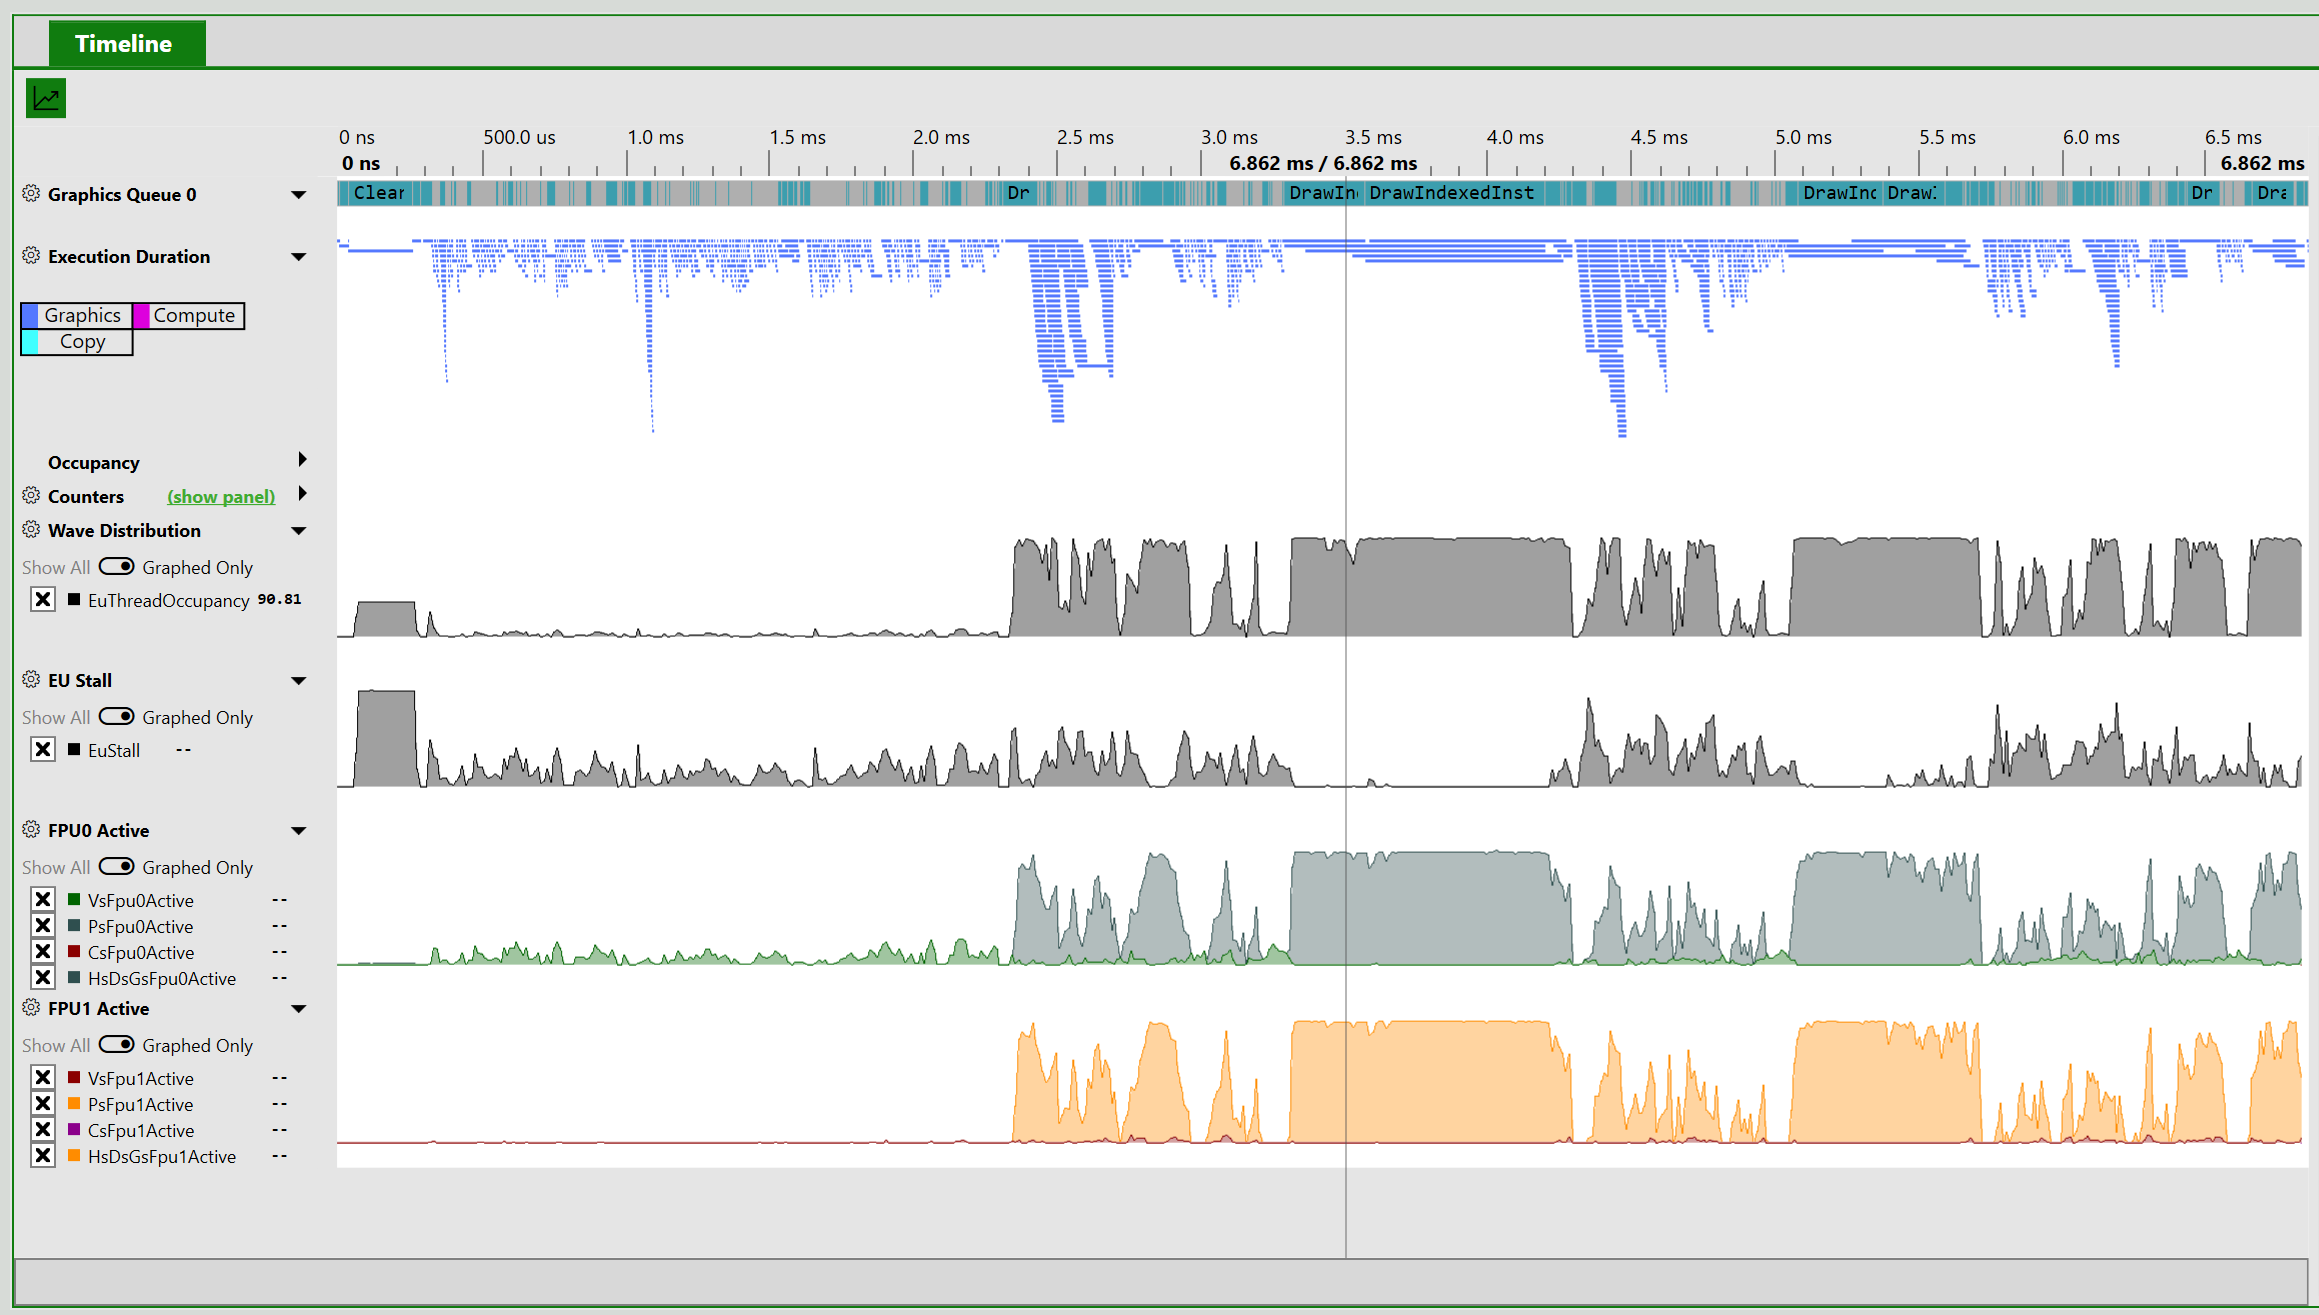
On Intel® Graphics Technology adapters, the hardware threads on each Execution Unit (EU) can be in one of the three states:
- Loaded – a Thread State Register File (TSRF) slot was allocated for the thread on an EU. Each EU has a maximum of 7 or 8 TSRF slots, based on GPU generation.
- Active – at least one instruction from the loaded thread is being executed on one of the two Floating Point Units – FPU 0 and FPU 1 (also called EM – Extended Math unit).
- Stalled – execution of next instruction for the thread is blocked until an existing data dependency is resolved.
The following metrics characterize the EU utilization efficiency:
- EU Thread Occupancy – average percentage of loaded threads relative to the total number of TSRF slots on the whole GPU over the measured interval. If the EU Thread Occupancy value is low, this indicates one of the following:
- There is a bottleneck on the GPU front-end (command parsing, vertex fetching, rasterization, etc.).
- For Compute shaders: more threads cannot be loaded on the EUs due to high Shared Local Memory (SLM) usage per thread group or compilation into lower SIMD width (for example, SIMD8 instead of SIMD16) due to to high temporary register variable usage.
- EU Stall – percentage of EUs stalled relative to the total number of EUs on the GPU over the measured interval. An EU is considered stalled if it has one or more loaded threads, but all of them are stalled. High EU Stall value means that a lot of EUs are waiting for data dependencies. Check the Sampler and Memory (GTI) metrics to further triage the problem.
- FPU0 Active & FPU1 (EM) Active – percentage of time where FPU0 or FPU1 (EM) pipeline was active executing instructions from one of the loaded threads. Low values indicate that EUs are either stalled or have low occupancy (see EU Stall and EU Thread Occupancy respectively). High imbalance between activity of these pipelines usually indicates the extensive usage of Extended Math instructions (log, sqrt, cos, etc.). Try to reduce Extended Math instructions usage to resolve this.
For more information, see “Shader Optimizations” section of Developer and Optimization Guide for Intel® Processor Graphics Gen11.
NVIDIA Counter Acronyms/Terms
Here are definitions for common acronyms and terms that you will find in NVIDIA’s counters in PIX on Windows:
| ALU | Arithmetic Logic Unit. The ALU is responsible for execution of most bit manipulation and logic instructions. It also executes integer instructions, excluding IMAD and IMUL. On NVIDIA Ampere architecture chips, the ALU pipeline performs fast FP32-to-FP16 conversion. |
| CROP | Color Raster Operation is the portion of D3D Output Merger that performs blending and color write. |
| CTA | Cooperative Thread Array, another name for HLSL thread groups in compute shaders. |
| DRAM | Memory controller for dedicated VRAM. |
| DRAMC | DRAM Controller for dedicated VRAM. |
| FBPA | Frame Buffer Partition connects the L2 cache to DRAM controllers. |
| FBSP | Frame Buffer Subpartitions contain the DRAM controllers. |
| FE | Front End unit receives GPU commands and sends them to the graphics and compute engines. |
| FMA | Fused Multiply Add/Accumulate. The FMA pipeline processes most FP32 arithmetic (FADD, FMUL, FMAD). It also performs integer multiplication operations (IMUL, IMAD), and as well as integer dot products. On NVIDIA Ampere GA10x architecture cards such as a RTX 3080, FMA is a logical pipeline that indicates peak FP32 and FP16x2 performance. It is composed of the FMAHeavy and FMALite physical pipelines. |
| FMALite | FMALite performs FP32 arithmetic (FADD, FMUL, FMA) and FP16 arithmetic (HADD2, HMUL2, HFMA2). |
| FMAHeavy | FMAHeavy performs FP32 arithmetic (FADD, FMUL, FMAD), FP16 arithmetic (HADD2, HMUL2, HFMA2), and integer dot products. |
| GPC | Graphics Processor Cluster (GPC) contains most of the graphics and compute processing units, including PES, PROP, RASTER, and TPCs. |
| GPU | Graphics Processor Unit |
| GR | GR is the unified graphics and compute engine. |
| Host | The Host unit fetches and dispatches commands for all GPU engines. |
| Hub | The Hub area of the GPU contains the central logic for all engines, the Host unit, PCIe, and NVLINK connections. |
| IDC | The InDexed Constant Cache is a subunit of the SM responsible for caching constants that are dynamically indexed with a register. |
| L1TEX | L1 Data Cache and Texture Unit handles global, local, shared, texture and surface operations from the SM, and certain kinds of texture copies. |
| LSU | Load Store Unit. The LSU pipeline issues load, store, atomic, and reduction instructions to the L1TEX unit for global, local, and shared memory. It also issues special register reads (S2R), shuffles, and CTA-level arrive/wait barrier instructions to the L1TEX unit. |
| LTS | L2 Cache Slice is the basic building block of the L2 cache. |
| PCI/PCIE | PCI Express endpoint, connecting the GPU to the rest of the system. |
| PDA | Primitive Distributor is part of the D3D Input Assembler. |
| PES | Primitive Engine Shared implements the D3D StreamOut functionality. |
| PROP | Pre-Raster Operation is the portion of D3D Output Merger in the GPC that connects RASTER, SM, CROP, and ZROP.” |
| RASTER | Raster implements the rasterization portion of the D3D Rasterizer stage, including ZCULL. |
| ROP | Raster Operation unit, containing the CROP and ZROP units. |
| SM | Streaming Multiprocessor is the unified shader processing unit in the GPU. |
| SMSP | Streaming Multiprocessor Sub-Partition contains a warp scheduler, register file, and instruction pipelines. |
| TPC | Texture Processor Cluster contains SMs and Primitive Engine Local, including VAF. |
| VAF | Vertex Attribute Fetch implements part of the D3D Input Assembler, fetching data for Vertex Shaders. Part of the Primitive Engine hardware. |
| VPC | Viewport Clip Cull is the last stage of primitive processing before rasterization. VPC implements the first part of the D3D Rasterizer stage. |
| VTG | Vertex, Tessellation, and Geometry shader stages. |
| XU | Transcendental and Data Type Conversion Unit. The XU pipeline is responsible for special functions such as sin, cos, and reciprocal square root. It is also responsible for int-to-float, and float-to-int type conversions. |
| ZROP | Z Raster Operation is the portion of D3D Output Merger that performs the Depth (Z) and Stencil test and modification. |
| Issue Active | Activity of the SM’s instruction issue stages. |
| Unallocated Warps in Active SMs | Unallocated warp slots within SMs that have at least one allocated warp. These warp slots may not be available to accept more shader threads, if an SM resource is fully utilized by the allocated warps. SM resources are registers, 3D attribute memory, compute shared memory, and CTA slots (compute thread group slots). |