

An autologger (boot trace) is a trace session that starts automatically at system boot. It is important for Software Engineers to investigate how their drivers and apps are operating during the boot. Windows provides a way to start the trace session at an early stage of boot process through the registry setting. Because setting those registry keys and values are cumbersome, most tracing tools support setting up the autologger thru the command line. WPR is not an exception.
The application of the autologger is not limited to boot time investigation. The autologger is a convenient way to start “always-on” trace, logging to a small circular buffer. By having always on trace, you can snap the trace when something interesting happens. Let us find out how to start and stop the autologger trace session using WPR.
Before starting…
WPR began supporting the autologger more than a few years ago(2017) but you may have an older WPR which does not support the autologger. You can check using the command : wpr -help boottrace
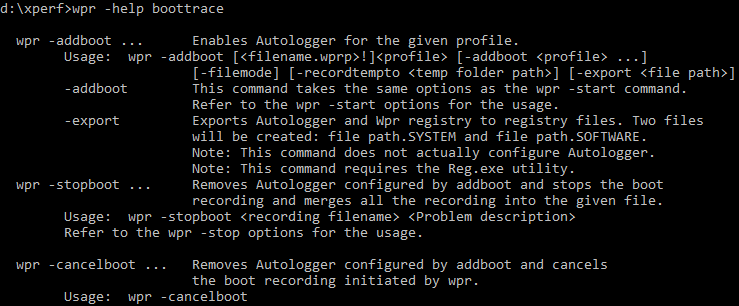
If the command doesn’t yield an invalid command error but you see the different boottrace syntax text, then the autologger is supported on the version of WPR. The main difference is that the current version of WPR has a simplified command line syntax. WPR also supports the old syntax for backward compatibility. When in doubt, install the latest WPR through Windows Insider Preview ADK. The setup instruction is explained in WPR Intro.
Setting up the boot trace (autologger)
The command syntax to configure the boot trace is same as the start command. Instead of the –start flag, use the -addboot flag. For example,
wpr -addboot GeneralProfile.Light -filemode -recordtempto d:\temp (Setting up the autologgers using builtin GeneralProfile)

wpr -addboot CustomProfile.wprp!WPRTest.light (Setting up the autologgers using the custom profile)
Once you set up the autologger like the example above, the trace will start automatically at the early stage of the next boot.
Saving the boot trace
The command syntax to save the boot trace is the same as the stop command. For example,
Wpr -stopboot boottrace.etl
The -stopboot command stops the trace and also removes the autologger from the registry. As long as the autologger configuration remains in the registry, the trace will start at every boot.
Canceling the boot trace
If for any reason you need to cancel the boot trace, -cancelboot command cancels the on-going trace session as well as removes the registry settings of the autologger. You can do -cancelboot at any point, even before the reboot.
Exporting the autologger registry keys
In case you need to export the autologger registry keys in text file, you can do that using the -export command.
wpr -addboot wpr.wprp -export boottrace.reg
This command creates two text files as below.
- Boottrace.reg.SYSTEM – ETW autologger registry keys
- Boottrace.reg.SOFTWARE – WPR’s session state keys
WPR configures two parts of the registry to set up the autologger. One is for the actual ETW registry keys and the other is the set of keys for WPR to manage the session. Windows will start the trace session as long as the ETW autologger registry keys (boottrace.reg.SYSTEM) are set. However, without WPR session state keys (boottrace.reg.SOFTWARE) WPR cannot save the trace. In this case, you need other tracing tools to stop the tracing session such as xperf. The ETW registry keys are documented well in MSDN and you will be able to see why it is hard to set the keys manually.
The export command is useful for the trace that needs to start at very first boot where you cannot do wpr -addboot to setup the boot trace. In that case, you can bake the registry keys to the SYSTEM and SOFTWARE hives and start the autologger at the first boot.
Closing
Setting up the autologger and collecting the trace is as easy as starting/stopping the trace. Autologger makes the boot phase performance investigation possible and a convenient way to start “Always on” trace. I hope these commands can help your performance investigation.
Is there a way to set the sample rate for boot traces? Sometimes I want a higher sample rate of up to 1250 to capture also fast methods. Another idea I was playing with was to start a CPU stress tool to make everything slow but this generates then huge traces. Or would flushing the L3 Cache in a loop would achieve a similar effect?
Interesting. I want to try.