
Performance and Diagnostics
Platform Health & Diagnostics Tools
Latest posts

Deep Dive Analysis: Why did this dll increase in file size by 50%?
We recently noticed that one of the dlls that we produce had suddenly jumped up in file size. The WinUI Controls library, Microsoft.UI.Xaml.Controls.dll that ships as part of Windows App SDK had ballooned in size in our internal builds. It had suddenly grown from 7 MB to 10.5 MB - approximately a 50% increase in size. What had happened to cause this? We needed to investigate the issue and fix it. This post is a deep dive into the analysis that was done to figure out what caused this sudden increase in file size and how it could be fixed. File size of a dll is important not just due to its impact on diskspac...

ETW Trace Processing Fails with Error Code 0x80070032
TL;DR New values in an existing ETW event aren’t supported, and a new version of the Windows Performance Toolkit (WPT) or the Microsoft.Windows.EventTracing.Processing.Toolkit NuGet library is needed to process traces with these events. About this failure We began to receive reports of WPA failing to process traces with this error code in late 2022. Debugging revealed the error code was due to previously unseen values in an existing CLR event describing a ReJIT operation. This event is used by WPA, XPerf, and EventTracing libraries to map address references from .NET binaries to source file and line informa...
Filtering events using WPR
More often than not, we collect bigger trace files than we really need. Even though what we are interested in are just a few types of events from an event provider. Or other times, we want to see the call stacks of just a few events but not the rest from the event provider. Turning on the event provider with stacks without any filtering can result in a ton of events from the provider plus stack-walk events for every event, bloating the trace. That means a few interesting events are buried under a pile of uninteresting events. Not only does the bloated trace make it hard to find the needle in the haystack, but als...
Recording Hardware Performance (PMU) Events with Complete Examples
Performance Monitor Unit (PMU) events are used to measure CPU performance and understand workloads CPU characterization. Windows provides a way to collect PMU events through Event Tracing for Windows (ETW). When combined with other ETW events, we can tell a lot more concrete story about the performance. I recently added “Recording Hardware performance (PMU) Events” in docs.microsoft.com site. Using the hardware counter is an advanced subject and I couldn’t add all the specific details. This article is a recap of the documentation with focuses on how to use the perf tools such as WPR and Xperf to use PMU events. I...

Reduce Process Interference with Task Manager Efficiency Mode
Task Manager Efficiency mode is a new feature that gives you options to ensure certain running processes won’t stress the CPU out, leading to faster foreground responsiveness and better energy efficiency. It also helps you to identify apps that are already running in Efficiency Mode and are good citizens of the OS.
New Android logcat support available in Microsoft Performance Tools for Linux & Android
We recently added support for parsing Android logcat logs to the OSS Microsoft-Performance-Tools-Linux-Android project. Logcat is a text-based dump of system & app messages on Android. This is what the logcat log would look like when loaded in Windows Performance Analyzer (WPA) Logcat for performance Logcat is useful in general, but why do we find it useful for performance work? Don’t we already have an official performance tooling available with a full-featured and system-level Perfetto tracing? The answer is yes Perfetto is great for deep level system tracing, but one shortcoming is that Perfetto d...
Perfetto tooling for analyzing Android, Linux, and Chromium browser performance – Microsoft-Performance-Tools-Linux-Android
Introduction In the last blog post, we introduced the cross platform open-source .NET Core Microsoft-Performance-Tools-Linux-Android tooling. Recently, we just released version 1.2 adding Perfetto support, which we will cover here. Perfetto is Google’s open-source tracing ecosystem covering Linux kernel tracing (and user-mode) and built into Android. Perfetto is best-in-class for Android tracing. The Perfetto ecosystem covers System Profiling, In-App Tracing, Trace Viewer, and Trace Analysis. The Perfetto ecosystem is Google’s equivalent of the Microsoft Event Tracing for Windows (ETW) ecosystem. We wo...

New tools for analyzing Android, Linux, and Chromium browser performance – Microsoft-Performance-Tools for Linux-Android
Introducing the Microsoft Performance Tools for Linux & Android
Authoring Custom Profile – Part 3
This blog post explains EventProvider element in WPR profile and its child elements and attributes. Among many elements of the profile, EventProvider is the most used element and most configurable.
SizeBench: a new tool for analyzing Windows binary size
A new tool called SizeBench has been released to the Microsoft Store, which helps with understanding binary size on Windows. This static analysis tool can break down a binary in many ways, and has heuristic analyses to look for likely sources of waste, and this blog post goes on a tour of what the tool can do.
WPA: Table & Graph Configurations (Part 2)
In Part 1, we discussed the different types of columns options available in WPA's table views and how those views can be configured. This blog will continue the series by digging into how to configure columns for different graph styles that can show numeric aggregations, time, and hierarchical data: Graphing Overview Before we dive into how to configure the tables and graphs, we should do a quick introduction to the Group & Graph bars in WPA's tables. Any column in the Data Area or Graphing Element Area can be aggregated (see Part 1 - Aggregation). Aggregated columns are graphed wh...
Setting up an autologger with WPR
WPR supports configuring an autologger. Setting up the autologger and collecting the autologger trace is as easy as starting/stopping the trace. This article introduces how to start, stop, and cancel the autologger as well as export the autologger registry keys.

Introducing EcoQoS
EcoQoS is a new Quality of Service (QoS) level introduced to Windows that developers can now opt-in to run their work efficiently, leading to better energy efficiency/increased battery life, reduced fan noise and power/thermal throttling.
WPR fails to start, insufficient system resources?
From time to time, I get questions about insufficient system resource error (0x800705aa) when starting the trace using WPR. The error can be frustrating, especially when there is enough memory and storage space left on the system. Some people try to solve the issue by increasing the system resources such as killing some apps and services. It does not help. I agree. It is frustrating to see generic error messages like this which can mean many things. Let us find out what causes this error and how to resolve the situation. Cases where WPR throws ERROR_NO_SYSTEM_RESOURCES error This insufficient system resource er...
Controlling the event session name with the instance name
In this post, I explained what the session name is in ETW and how to set the session name through WPR with the instancename option.
Windows Performance Analyzer – Table & Graph Configurations (Part 1)
In the previous post, we discussed a brief intro into Windows Performance Analyzer (WPA) and its feature set. WPA can display trace data in a wide array of formats, most of which are pre-configured as presets designed for drilling into specific data points. Here is one for example: WPA's CPU Usage (Sampled) table has a few different presets, each reconfigures the view of both table and graph data. This blog post is the first of a multi-part series that goes into detail on how to configure the table and graph views to create your own presets: Column Options Depending on the column's da...
Authoring Custom Profiles – Part 2
In this post, we enhance the simple custom profile for WPR by adding the system tracing session. Because kernel events provide critical information about processes, threads, modules, and more, collecting the system events greatly extends your ability to analyze traces and diagnose issues.
Authoring custom profiles – Part 1
This is the first post in a multi-part series about authoring custom profiles for Windows Performance Recorder (WPR.) In a previous post, we have looked at how to start a trace with built-in profiles. The built-in profiles offer wide variety of preset profiles that we can use for different scenarios. There are built-in profiles for CPU usage, Networking I/O activity, VirtualAlloc usage, Xaml activity, and many more. However, none of the built-in profiles will collect any custom instrumentation you may have added to your code. To record a trace capturing your specific events you will need to author a custom pro...
WPR Start and Stop Commands
In this post, we show how to start and stop the trace using WPR. The first step is doing 'wpr -help start'. The command parameters seems to be cryptic. We explain those parameters in detail with examples.
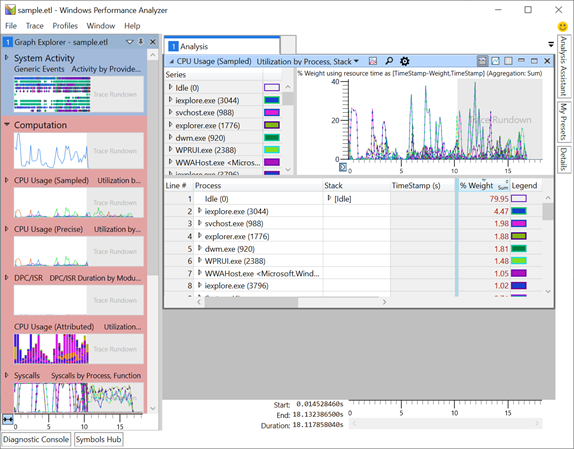
Windows Performance Analyzer “WPA” Intro
If you do a search online for WPA, you might find information for protecting your Wi-Fi, but that is a different type of WPA. In the performance & diagnostics space WPA stands for Windows Performance Analyzer, a friendly but intricate UI that allows for developers and analyst to deep dive into performance traces captured on Windows (and beyond…but more on that in a future post 😊). Its great for discovering why CPU utilization is high? How much memory is being used in the system per process? Why does WPA itself use so much memory? WPA has siblings that help record traces on Windows, Windows Performance R...
WPR Intro
This is the first blog post about WPR. WPR is an acronym for Windows Performance Recorder. This post introduces list of acronyms that are used commonly performance tools, installation steps, the difference between WPR and WPRUI, and finally about the instance name and the error.