
Introduction
We wanted to announce and introduce you to a new set of powerful open-source tools for analyzing system performance – Microsoft-Performance-Tools for Linux-Android. Recently, we just released version 1.2 adding Perfetto support, which we will cover in a separate blog post!
Microsoft-Performance-Tools for Linux-Android is a set of trace processing tooling that delivers many of the great features, power, methodology and ecosystem, that has been used to drive Windows performance for the past 15+ years with an evolving and refreshed toolset.
This type of tracing & tooling gives amazing depth & insight into what the OS and app code is doing; and can be used in a variety of diagnostic & performance scenarios. If the analysis scenario also involves Windows, then traces can optionally be co-analyzed on the same timeline with Windows performance traces.
The toolset is built on open-source .NET Core and the new microsoft-performance-toolkit-sdk. This means the toolset is cross-platform and traces can be opened and analyzed on any OS that .NET Core supports! We have worked with the OSS community to build on top of the existing best-in-class open-source tracing for any given OS.
Tracing
For Linux, we support LTTng, perf, and Perfetto. For Android and Chromium browsers such as Chrome & Edge Chromium, we support Perfetto.
Here is the current tracing supported:
- LTTng (Linux Kernel CPU scheduling, Processes, Threads, Block IO/Disk, Syscalls, File events, etc)
- perf Linux CPU Sampling(cpu-clock)
- Perfetto Android & Chromium (CPU Scheduling, CPU Sampling, CPU Frequency, FTrace, Android Logs, Generic Events / Default Tracks, GPU Counters)
The tooling supports parsing & analyzing the above tracing. Capturing & recording a trace is different for each type of tracing tool and is covered in How to capture a trace or logs.
You can process or dump events at the cmd-line using your own custom program with only a few lines of code. For example, there is a LTTngDriver which uses Microsoft.Performance.Toolkit.Engine to drive programmatic access to the traces in the C# language.
Any program or GUI on any OS can process events with the Microsoft-Performance-Tools SDK & Linux-Android plugins. Additionally, if you are optionally on a Windows machine to analyze the traces, the toolkit has great integration with Windows Performance Analyzer so that you can use a powerful GUI to analyze the traces.
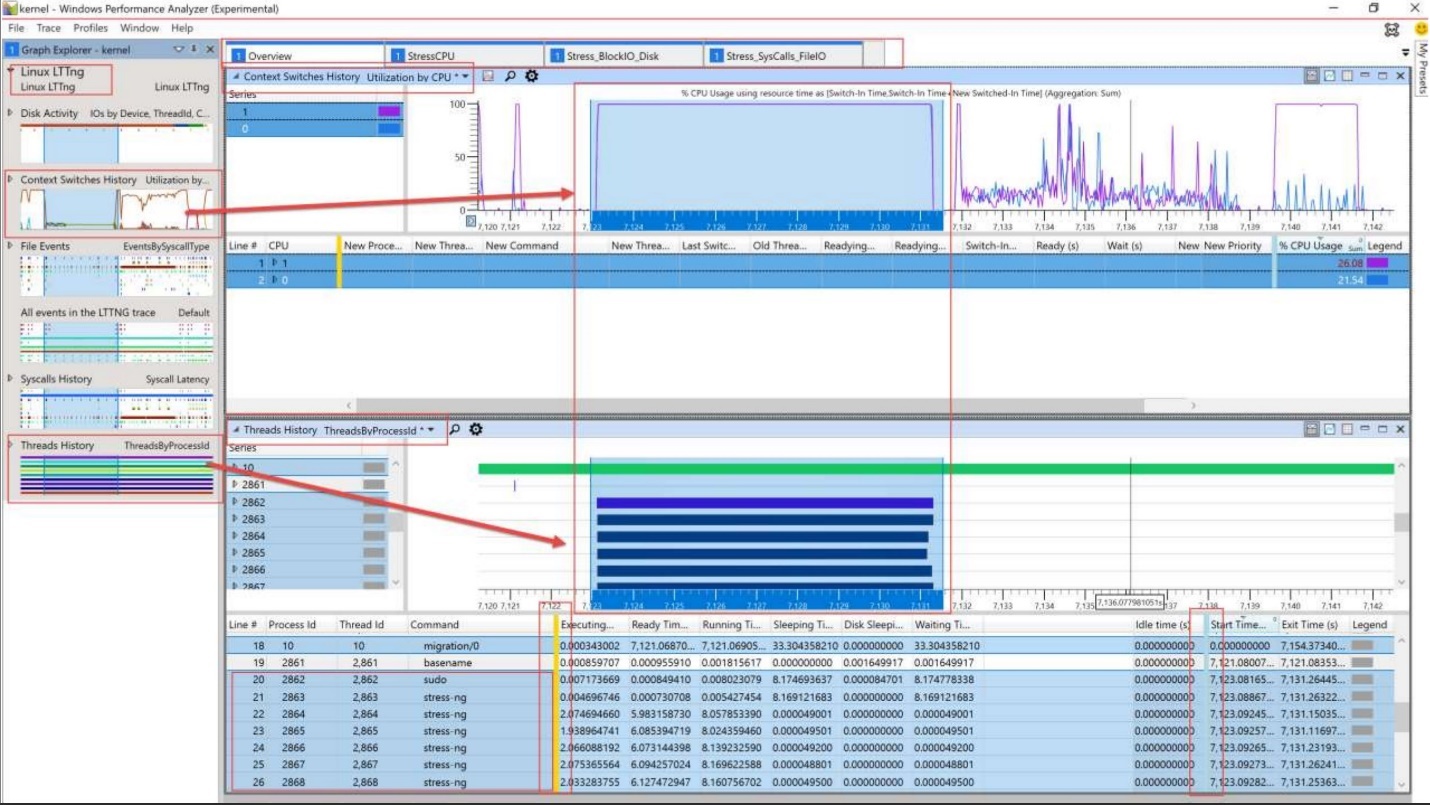
Figure 1 – Linux LTTng system trace loaded in WPA
Conclusion
We hope you can use the tooling to analyze & improve performance; whatever your OS, device, or scenario! Internally at Microsoft – we are using the toolset to help gain insight and drive performance on these products:
- Windows Subsystem for Android (WSA) which runs native Android apps in a VM with great Windows integration
- Azure Linux VMs and Windows Subsystem for Linux (WSL2) which each run Linux in VMs
- Microsoft Edge browser which is cross-platform and based on Chromium
We also hope that you can join the community or contribute to this tooling on our GitHub page.
0 comments