


Debugging rarely starts with a clear answer. An app crashes, a service hangs, a driver fails, or a kernel dump offers few clues. Whether you’re working with a live target, crash dump, or Time Travel Debugging (TTD) trace, the first question is the same: Where do I start, and what should I investigate next?
Today we’re introducing WinDbg MCP, a natural-language interface for WinDbg built on Model Context Protocol (MCP). It connects AI clients such as GitHub Copilot CLI and Visual Studio Code to an active WinDbg session, so you can investigate user-mode and kernel-mode crashes and hangs in plain language, grounded in debugger evidence. With safeguards on by default and AI-initiated actions visible in WinDbg, you move from symptoms to evidence-backed hypotheses and clear next steps while staying in control.
The Diagnostician skill adds a structured, repeatable root-cause workflow for apps, services, UMDF drivers, and kernel-mode drivers. It treats pattern matches as hypotheses, tests alternatives, and delivers candidate root causes with targeted next steps and clear evidence gaps.
What is WinDbg MCP?
WinDbg MCP is an MCP server in WinDbg that connects AI clients to a live WinDbg session through a local proxy. You can ask an AI client to inspect the current target, run debugger commands, review diagnostics and source code, visualize debugger data, or create scripts for repeatable analysis.
Currently, officially supported AI clients are Visual Studio Code and GitHub Copilot CLI. Claude Code may work if you disable cross-prompt injection protection, which we don’t recommend. See Using other MCP clients in Get Started for details.
Why we built it
We built WinDbg MCP so in GitHub Copilot CLI or VS Code Copilot you can ask something as simple as: “Root cause this crash, show the supporting evidence, and state any unverified assumptions.” Getting from a symptom to a defensible root cause used to mean knowing which WinDbg commands to run, how to read their output, and what evidence to gather next. That was a high bar for new developers and a time sink for experienced ones.
Now you describe the problem in natural language, and skills such as Diagnostician add a repeatable process for gathering evidence, testing hypotheses, and flagging what remains unknown. New users can start without mastering the command set and learn as they go by watching the AI-driven commands run in WinDbg. Experienced engineers can move faster through repetitive analysis and focus on validating the root cause and choosing the right fix.
Get Started
WinDbg MCP is included starting with version 1.2610.1001.0 and available from the Microsoft Store and WinDbg download page.
- Open WinDbg and go to MCP service settings.
- Ensure Enable Server is selected and choose VS Code or GitHub Copilot CLI.
- Select Install MCP to register WinDbg with the selected client.
- Select MCP Service, review the Privacy and Security Warning and the Secure Mode option, and then select Yes to start the service.
- Load or attach to a debugging target.
- Select Open Chat and start your investigation.
The following demo shows a user connecting GitHub Copilot CLI to an active WinDbg session and beginning an investigation: View demo full size
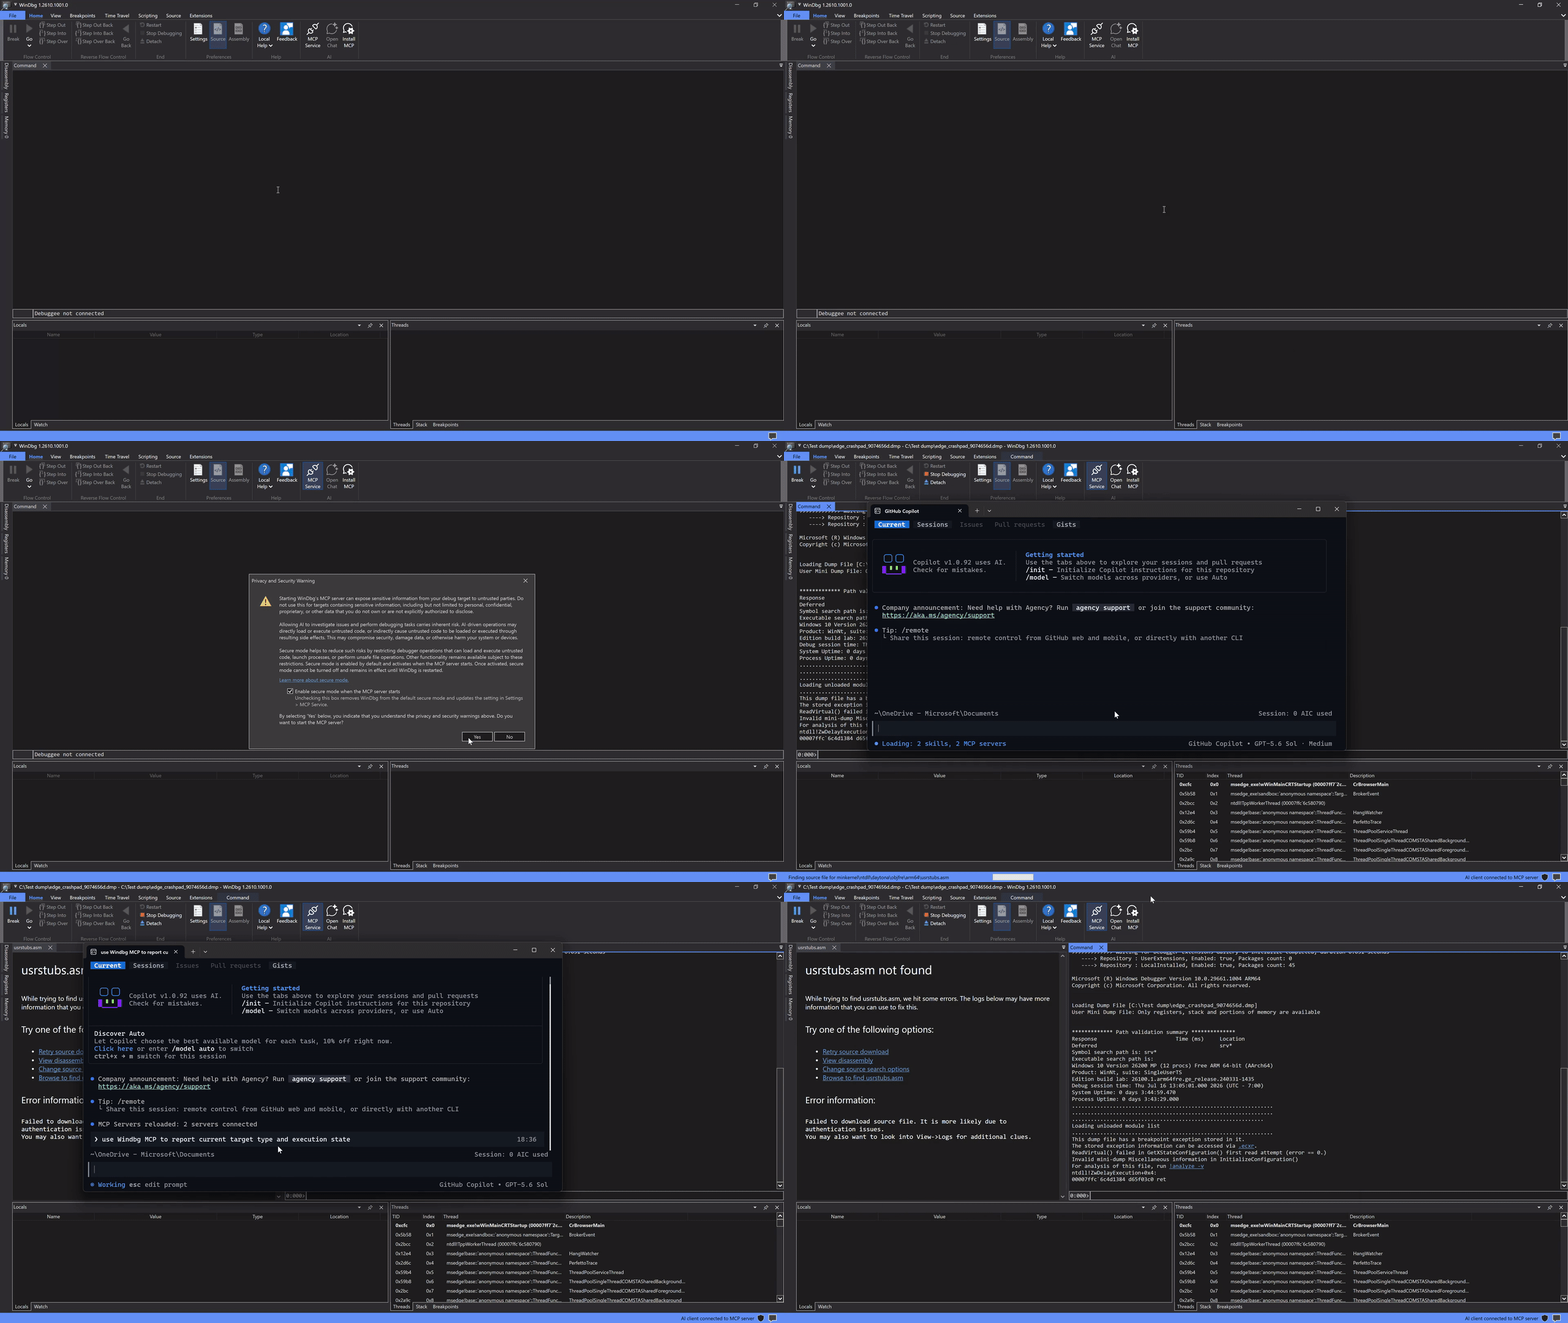
For detailed setup instructions and prerequisites, see Set up and use WinDbg MCP. To report a problem or suggest an improvement, visit the WinDbg Feedback repository.
Using other MCP clients: Other MCP-compatible clients, such as Codex and Claude Code, may work with custom configuration on a best-effort basis. Because these clients don’t currently support MCP sampling, using them requires turning off cross-prompt injection protection. Consider the reduced protection before connecting to a target.
Example debugging flow
Imagine opening a crash dump without knowing where the failure began. Start by describing what you want to understand:
| Analyze this crash dump and identify the likely root cause. Include supporting debugger evidence and any assumptions that remain unverified. |
WinDbg MCP can inspect the target using relevant debugger tools and organize the findings into an initial hypothesis. You can then ask what evidence supports the conclusion, which alternatives remain, and what to investigate next.
Structured root-cause triage with Diagnostician
Diagnostician brings Windows-specific debugging playbooks to GitHub Copilot CLI through WinDbg MCP. It runs a repeatable five-phase investigation, treats pattern matches as hypotheses, and reports candidate root causes with targeted validation steps. It supports apps, services, user-mode drivers (including UMDF), and kernel-mode drivers.
Diagnostician is part of the windbg plugin in the public win-dev-skills catalog. With Git and GitHub Copilot CLI installed, your target loaded in WinDbg, and the MCP service connected:
- Add the catalog: copilot plugin marketplace add microsoft/win-dev-skills
- Install the plugin: copilot plugin install windbg@win-dev-skills
- Start a new Copilot CLI session and enter:
| Root cause the dump in the debugger. Let the diagnostician orchestrate the debugging session, test alternative explanations, and state what evidence is missing. |
Steps 1 and 2 are one-time setup. For a saved report, use the full investigation prompt in the windbg plugin README. When Copilot CLI can write files, it saves a Markdown report to .diagnoses\<short-id>\<yyyyMMdd-HHmmss>.md in the working directory.
Using a different AI client? See the note on other MCP clients in Get Started, including the cross-prompt injection consideration.
How it works
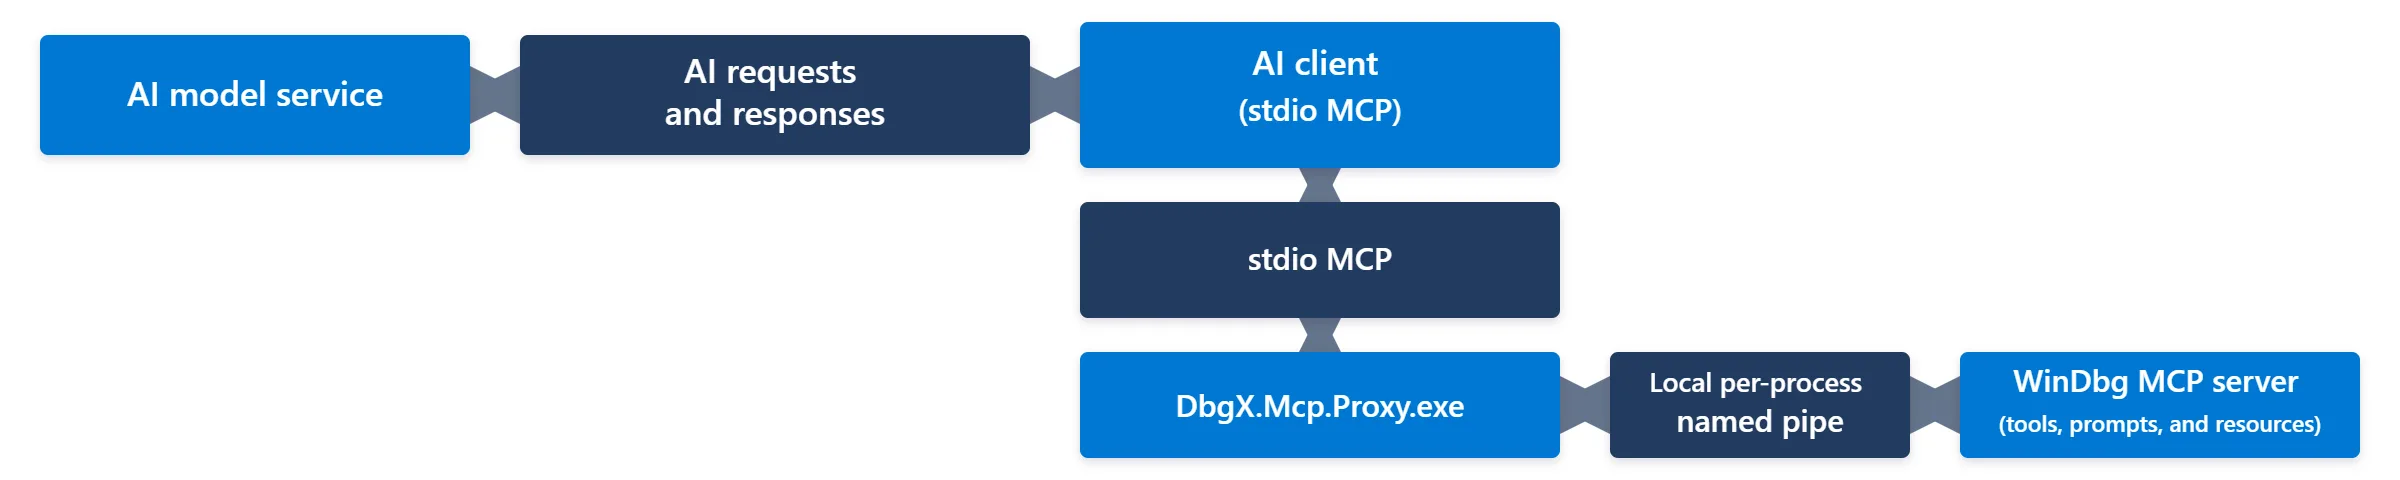
WinDbg MCP uses a local proxy to connect an AI client to a specific WinDbg session. The debugger connection remains local, while the AI client communicates with its configured model service according to that client’s configuration and data-handling policies.
When you ask a question, the AI client can invoke relevant WinDbg MCP tools based on the request. WinDbg performs the requested debugger actions and returns the results to the client for analysis. The actions remain visible in WinDbg so you can review what was run and validate the resulting findings. Only one active MCP client can connect to a WinDbg session at a time. If multiple sessions are available, you can select the one you want to investigate.
Built-in security protections
WinDbg MCP includes safeguards designed for AI-assisted debugging. AI-initiated actions are recorded in logs, providing an auditable record of what was run.
Secure Mode restricts high-risk operations, including loading or executing untrusted code, launching processes, and performing unsafe file operations. The option to enter Secure Mode is selected by default when you start MCP. Start MCP before connecting to a target for full Secure Mode. If a target is already connected, WinDbg enters partial Secure Mode and displays a warning. Once enabled, Secure Mode remains active until WinDbg restarts.
Cross-prompt injection protection checks debugger command output for content that could mislead the AI into unsafe actions. For protected operations, WinDbg uses the AI client’s configured model service to classify the output and blocks content identified as potentially unsafe. This protection requires a client that supports and permits MCP sampling and may use additional AI tokens.
Disable these protections only when working with an authorized target in a trusted environment and when doing so is permitted by your organization’s security and data-handling policies. For details, see the WinDbg MCP overview.
Use AI-assisted debugging responsibly
Built-in safeguards reduce risk, but AI-generated findings may still be incomplete or incorrect. Validate important conclusions against the target state and evidence visible in WinDbg, and review any generated or modified scripts before running them.
The AI client may send debugging context to its configured model service. Use WinDbg MCP only with authorized targets and in accordance with your organization’s AI, security, privacy, and data-handling policies.


This is awesome! Native integration is something we developers were all looking for.
Very useful, thanks a lot!
Congratulations, Shanthi and the WinDbg team! It is very exciting to see WinDbg + MCP making complex debugging faster, more intuitive, and accessible. Great work! 👏