

Data is a critical resource in any organization to guide decision making. When analyzed at scale, Microsoft 365 data can uncover insights to improve employee productivity, optimize business processes, safeguard your sensitive intellectual property, better serve your customers, and much more.
Microsoft Graph Data Connect is a secure, scalable data service to quickly copy relevant Microsoft 365 datasets into your Azure Synapse Analytics for advanced analytics and insights. In this blog, we will highlight the latest innovations including our streamlined data engineering pipeline, templates, and datasets.
What’s new?
We are simplifying and streamlining the data engineering pipeline to further accelerate comprehensive access to Microsoft 365 data:
- Microsoft 365 Synapse Template (available in public preview in late October)
- Mapping Data Flows (available in public preview in late October)
- Cleaned Outlook/Exchange Datasets (available in public preview in December)
Newly available templates highlight key components including datasets, pre-built data pipelines, and visualizations. Templates are designed to accelerate value generation by reducing the time and effort to implement an analytics solution:
- SharePoint Information Oversharing template (available in public preview in November)
- Organizational Network Analysis template (available in private preview in late October)
In addition to templates, we’re pleased to announce the availability of highly requested datasets to unlock deep enterprise analysis on the changing patterns of modern work:
- Planner and Tasks datasets (available in private preview by December)
- Usage and Activity datasets (available in private preview by December)
Simplifying and streamlining the data engineering pipeline
Microsoft 365 Synapse template
Within Synapse Analytics, we are adding a new pipeline template for Microsoft 365 data (highlighted in blue on the bottom left of the GIF below). This is a one-click create capability to aggregate and transform Microsoft 365 data into an analytics-ready format. Our Microsoft 365 pipeline template simplifies the configuration experience which saves time and effort.
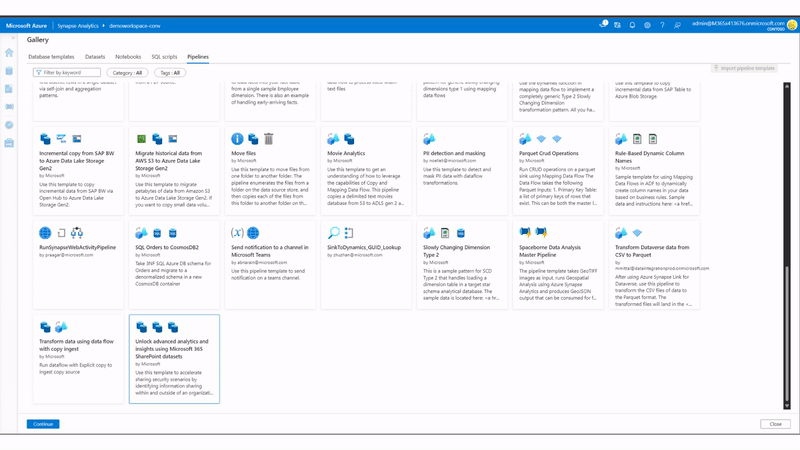
Learn More: Microsoft 365 Synapse template
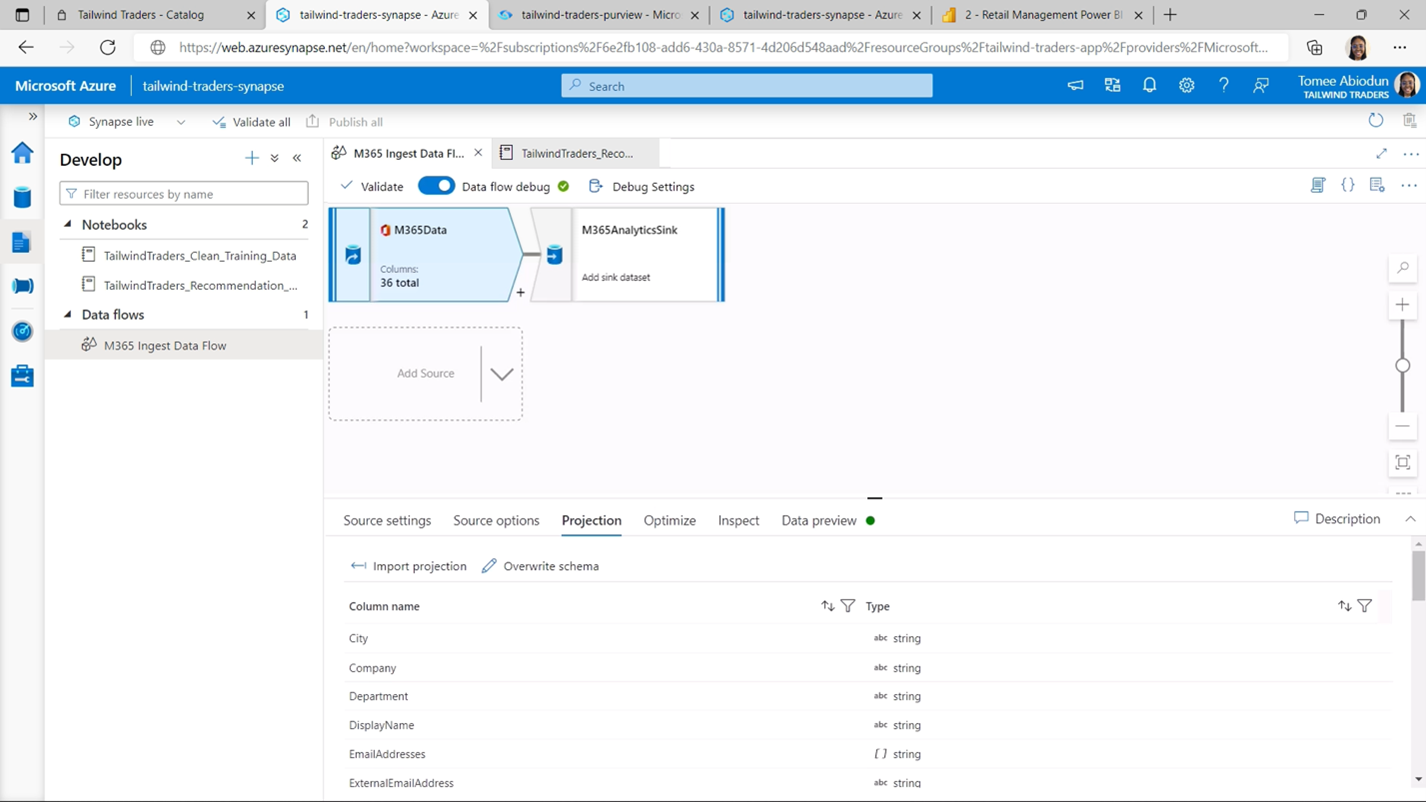
Mapping data flows
Mapping Data Flows will clean, normalize, and flatten the data (Parquet format) into multiple data sinks. This accelerates access to Microsoft 365 data for analysis:
- Flattened data (Parquet format) is much cheaper and faster to process with big data processing (such as Spark or Hadoop) which reduces cost and accelerates data analytics (lower latency) compared to JSON.
- Additional data sink support (for Cosmos DB and SQL DW) gives customers flexibility and greater efficiency in constructing data pipelines that optimize workflows.
This capability is launching in limited public preview sign-up which will be available here.
Learn more: Mapping data flows
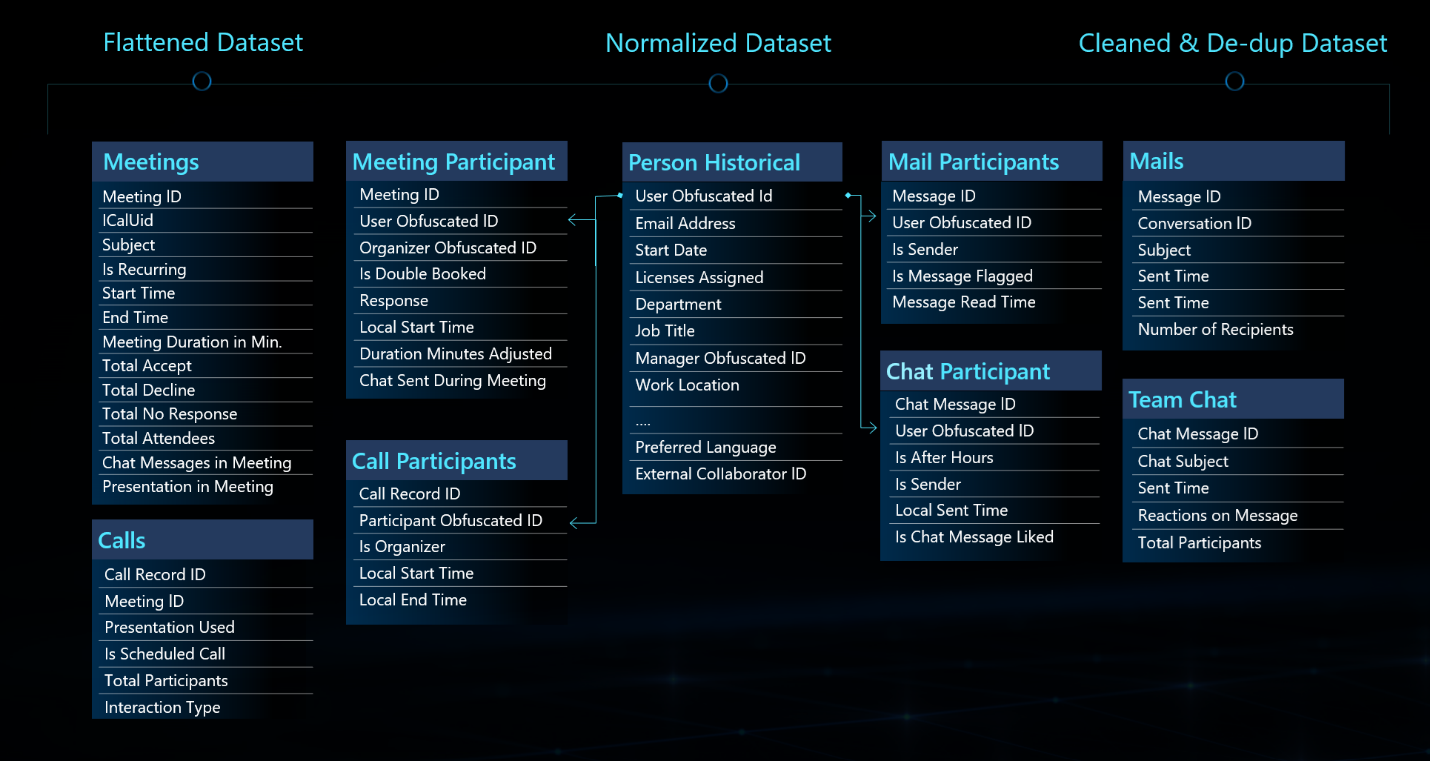
Cleaned Outlook/Exchange datasets
Outlook/Exchange data will be deduplicated and normalized prior to export for analysis (including emails, chats, and calendars). Moving forward, we will effectively only pull a single copy for analysis. The image below represents the flattened view of a cleaned Outlook/Exchange dataset that is ready for analysis.
Currently, if I pull an email that I sent to 10 internal people, this returns 11 rows for analysis (one copy of the email I sent email and one copy for each of the 10 recipients). Pulling duplicate copies of the same data export (such as multiple copies of the same email) is costly and inefficient without any improvement to analysis.
To normalize Outlook/Exchange data, email datasets will be presented in the industry standard view (Common Data Model and Industry Data Models view) which further reduce redundancy and anomalies that may negatively affect analysis.
Templates
Now that we have seen how Synapse templates, Mapping data flows, and Cleaned Outlook/Exchange datasets are making it easier and more cost effective than ever before, let’s look at two new solution templates that accelerate the time to insights.
SharePoint Information Oversharing template
SharePoint Information Oversharing is a security and compliance use case powered by our newly available SharePoint usage and activity (ODSP) dataset. This allows customers to better understand how Microsoft Information Protection (MIP) labels are constantly protecting SharePoint data, maintain information boundaries, and establish new rules based on how sensitive data is managed and classified.
- Required Microsoft 365 data sources and datasets:
- Azure Active Directory (AAD group details, AAD group owners)
- SharePoint (SP Groups, SP Sites, SP Sharing)

Learn more: SharePoint Information Oversharing template
Organizational Network Analysis template
Organizational Network Analysis (ONA) is a structured way to visualize how communications occur within the organization. Organizational Network Analysis harness information flows and team connectivity to unlock productivity, innovation, employee engagement, and organizational change. This can be useful in a wide variety of network related insights to:
- Measure the effectiveness of an agile transformation progress or enablement session. Conversely, detect post-merger integration or post-reorg issues.
- Reduce management escalations with the strategic introduction of shared services.
- Accelerate time to new hire integration (onboarding) by identifying gaps in shared learning to drive cross organizational learnings and best practices.
- Promote diversity and inclusion in the workplace by uncovering demographic imbalances.
Our newly launched Organizational Network Analysis template calculates, analyzes, and visualizes the connectivity within your organization with passive network analysis. Passive network analysis, as compared to self-reported surveys, measure interactions through existing email and meeting data resulting in minimal missing data, less upfront investment, and reduced time burden.
- Required Microsoft 365 data sources and datasets:
- Outlook (Outlook event, Outlook message)
- Teams (Teams chat)
- Azure Active Directory (AAD user)

*Disclaimer: Image above is a visual placeholder representing our ONA solution not a final product.
Datasets
We are also calling out two new datasets to understand the changing patterns of modern work.
Planner and Tasks datasets
Get rich project management insights about the completion of day-to-day tasks. Drive business efficiencies for frontline workers by measuring the hidden project management inefficiencies and drive organizational change in how your workforce is managed. In the Tasks and Project Management requirements below, we see (from top left, clockwise) overdue tasks by team, staffing levels over time, and an Excel-style readout of the data.
- Required Microsoft 365 data sources and datasets:
- Planner (Plans, Plan Assignment, Plan Historical)
- To Do tasks (Task, Task List, Task Details)
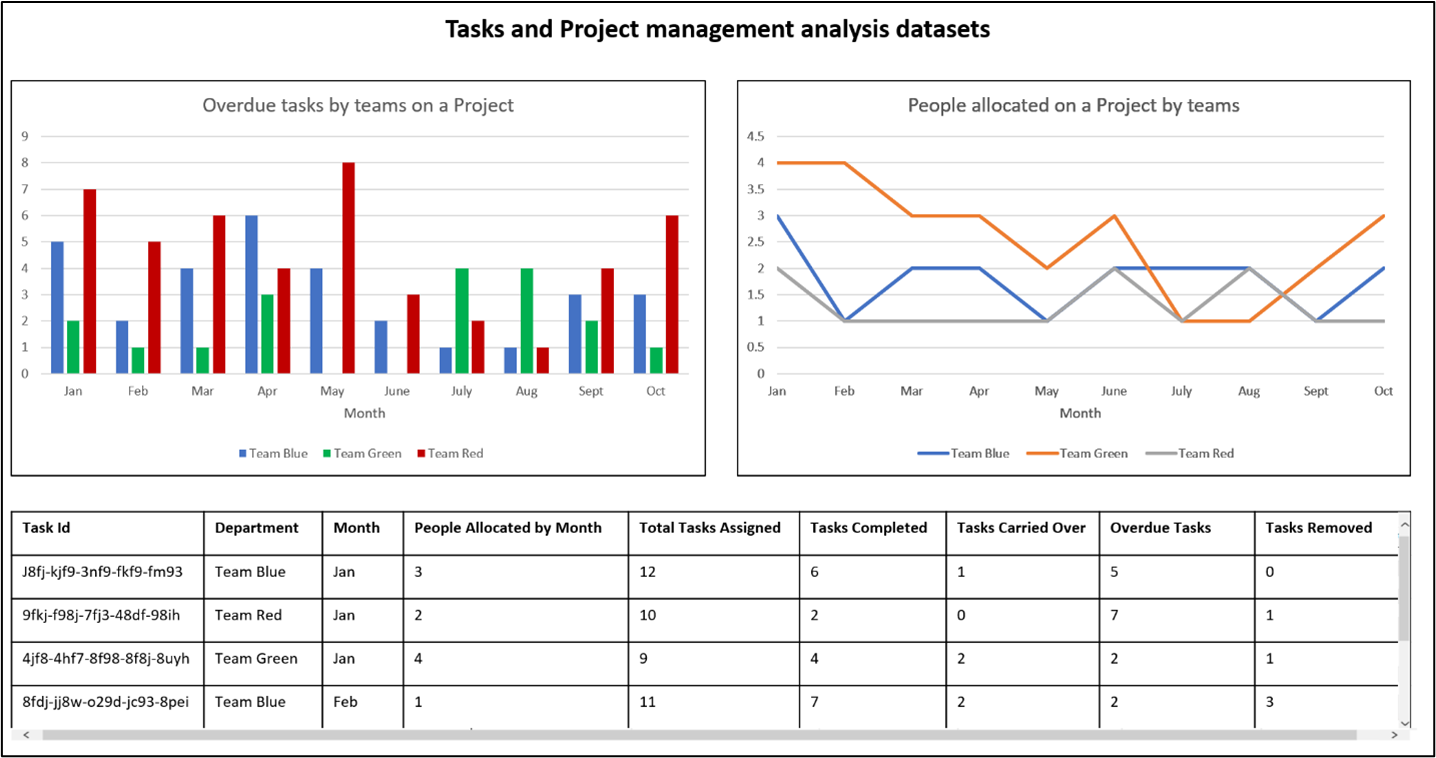
*Disclaimer: Image above is a visual placeholder representing an example of a dashboard built on the Planner and Tasks datasets not a final product.
Usage and Activity Datasets
As organizations are returning to hybrid work, they can analyze usage of physical conference rooms and meeting rooms that are happening within virtual spaces. Use data on occupancy and attending rates to craft a custom hybrid work strategy that works for your organization. In the Usage Activity report below, we see (from top left, clockwise) a breakdown of meetings (in room, online, and hybrid), meeting attendance by department, and meeting attendance month-by-month trends.
- Required Microsoft 365 data sources and datasets:
- Outlook (usage activity)
- Teams (activity)
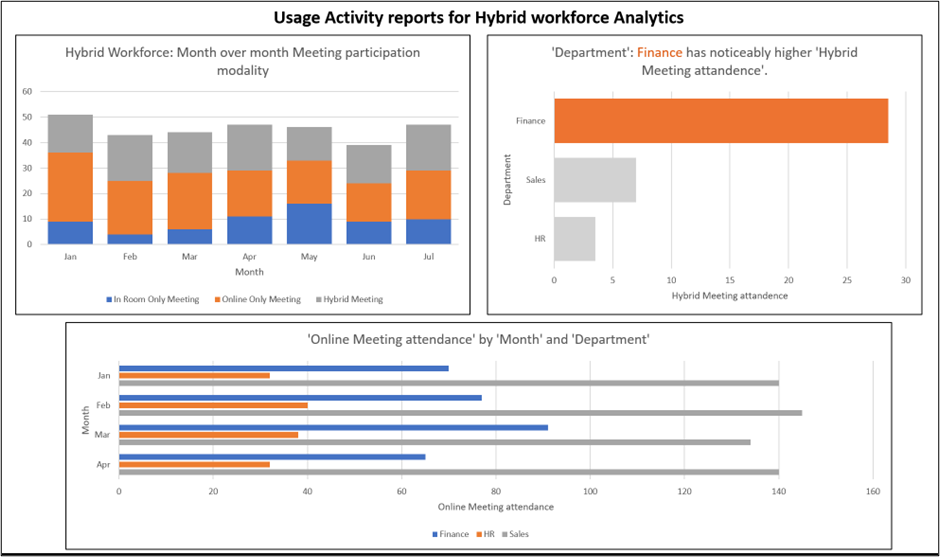
*Disclaimer: Image above is a visual placeholder representing an example of a dashboard built on the Usage and Activity datasets not a final product.
Learn more about the changing patterns of work: Hybrid Work Is Just Work. Are We Doing It Wrong? (microsoft.com)
Recap
In this blog, we’ve shared:
- New data engineering pipeline: Synapse templates, Mapping data flows, and Cleaned Outlook/Exchange datasets are scaling access to Microsoft 365 data to unlock deep enterprise analysis.
- New templates: SharePoint Information Oversharing and Organizational Network Analysis to accelerate the time to actionable insights.
- New datasets: Usage and Activity datasets for project management analysis and Usage and Activity datasets for hybrid work analysis.
To learn more about what you’ve seen above and more:
- Check out our Ignite breakout session: From low code to pro code: building and buying collaborative apps to power an evolving workplace (microsoft.com)
- Visit Microsoft Graph Data Connect to learn more: Microsoft Graph Data Connect | Microsoft 365 Developer
For a step-by-step guide to getting SharePoint Sites information using the Microsoft Graph Data Connect (MGDC) and Azure Synapse, check out this detailed set of instructions: https://barreto.home.blog/2022/10/17/gathering-a-detailed-dataset-on-your-sharepoint-sites/
Thank you for the wonderful information, especially the part about normalizing the dataset related to Exchange. Will the Dev Sandbox subscriptions be reinstituted? In order to test out all of these datasets, the Graph API, and E5 security policies, the subscriptions were very helpful. –> https://developer.microsoft.com/en-us/microsoft-365/dev-program