

Introduction
In today’s complex and distributed systems, observability is a critical aspect of maintaining and improving system performance and reliability. Observability allows us to gain insights into the internal state of our applications by collecting and analysing metrics, logs, and traces. This blog explores how to integrate Azure Monitor and Grafana with OpenTelemetry to create a robust observability solution that works seamlessly in both connected and disconnected environments.
Setting the Scene
Our team has recently been developing a system that runs both in Azure cloud and on edge devices such as Azure Stack Edge as well as other generic physical devices such as Intel NUCs. Whilst we could send metrics to Application Insights from both cloud and non-cloud based devices, our deployed environment posed a separate challenge – limited or no internet connectivity. One of our requirements was that our hybrid solution could operate in Denied, Degraded, Intermittent, and Latent (DDIL) environments, resulting in a loss of visibility when monitoring a device which becomes disconnected. It’s worth noting that our solution was deployed to a Kubernetes cluster, thus any observability tooling would also have to be deployed onto that cluster.
OpenTelemetry
OpenTelemetry is an open-source observability framework that provides a standardised way to collect metrics, logs, and traces. It supports various backends, including Azure Monitor, and integrates well with other open-source tools like Grafana, Prometheus, Loki and Tempo. By combining different observability providers with OpenTelemetry, we can create a hybrid observability solution that leverages the strengths of several platforms.
Application Insights vs Grafana Stack
Azure Monitor is a comprehensive monitoring solution for collecting, analysing, and responding to monitoring data from cloud and on-premises environments. One such feature is Application Insights, which can be used for application performance monitoring (APM) by monitoring live applications, collecting telemetry, and providing insights for diagnosing performance issues. Azure Application Insights excels in cloud-native scenarios, providing real-time application performance monitoring, telemetry collection, and distributed tracing. Its seamless integration within Azure simplifies deployment and scalability, making it ideal for centralized monitoring of connected systems.
The Grafana stack is comprised of several open source observability tools designed to monitor, visualise, and manage logs, metrics, and traces. Utilising some of these tools such as Grafana Loki for log aggregation, Grafana Tempo for distributed tracing, and Prometheus for metrics gathering. This results in a verbose output suitable for system monitoring. Grafana, with its modular stack (Prometheus, Loki, and Tempo), is highly flexible and excels in edge scenarios. Its customizable dashboards enable tailored visualizations for local users, ensuring observability in disconnected or intermittent connectivity environments.
While Grafana provides unmatched flexibility for edge environments, it requires more operational overhead to manage its infrastructure and tools. Conversely, Application Insights simplifies management but is less adaptable for edge-specific visualizations, and has a strong reliance on Azure.
The Best of Both Worlds?
To leverage the strengths of both Azure Application Insights and Grafana, we built a hybrid observability solution that provides comprehensive monitoring capabilities in both connected and disconnected environments. When the system is connected to the internet, we utilise Azure Application Insights
By integrating both Azure Application Insights and Grafana, we can achieve a seamless observability experience. When the system is connected, use Azure Application Insights to collect and analyse telemetry data, providing a comprehensive global view of the application’s performance and health. Activity tracing in Application Insights helps in tracking requests and dependencies across distributed nodes, offering valuable insights into the system’s behavior. When the system is disconnected, we use Grafana along with Prometheus, Loki, and Tempo to collect and visualise metrics, logs, and traces locally. This ensures continuous observability and monitoring capabilities, even in environments with intermittent or no internet connectivity. By combining these tools, we can create a flexible and resilient observability solution that adapts to different connectivity scenarios, ensuring that we always have the necessary insights to maintain and improve system performance and reliability.
Configuration
The simplified diagram below shows how we configured our data sources to connect into the OpenTelemetry Collector, and then export that data into the relevant observability tools.

For our project we used Helm templating to help deploy our Kubernetes manifests, we deployed OpenTelemetry via the OpenTelemetry helm chart and configured it using the OpenTelemetry collector configuration.
We can see in the example below how to configure OpenTelemetry exporters to pull from multiple data sources, we can also see that by using Helm variables we can optionally deploy exporters for Azure Monitor (via an Application Insights connection string), as well as if we have enabled disconnected telemetry (in this case the Grafana Stack) that additional endpoints are configured.
exporters:
  otlp:
    endpoint: 0.0.0.0:4317
  {{- if .Values.otelAppInsightsConnectionString }}
  azuremonitor:
    connection_string: {{ .Values.otelAppInsightsConnectionString }}
  {{- end }}
  {{- if .Values.disconnectedTelemetry.enabled }}
  prometheus/metrics:
    endpoint: "0.0.0.0:8889"
  otlp/traces:
    endpoint: tempo.telemetry.svc.cluster.local:4317
  loki:
    endpoint: {{ .Values.lokiEndpoint }}
    default_labels_enabled:
      exporter: true
      job: true
  {{- end }}
From within any code needing to produce telemetry, for example in our project we had services written in .NET and Python, we can simply use the OpenTelemetry SDKs provided to seamlessly integrate with a single telemetry tool, allowing us to take observability handling from a tightly coupled code activity to a configuration activity.
using OpenTelemetry;
using OpenTelemetry.Trace;
using OpenTelemetry.Metrics;
using OpenTelemetry.Logs;

var builder = WebApplication.CreateBuilder(args);

builder.Services.AddOpenTelemetry()
    .ConfigureResource(resource => resource.AddService("MyApp"))
    .WithTracing(tracing => tracing.AddOtlpExporter(options => options.Endpoint = new Uri("https://otel-endpoint")))
    .WithMetrics(metrics => metrics.AddOtlpExporter(options => options.Endpoint = new Uri("https://otel-endpoint")))
    .WithLogging(logging => logging.AddOpenTelemetry(options => options.AddOtlpExporter(exporterOptions => exporterOptions.Endpoint = new Uri("https://otel-endpoint"))));

var app = builder.Build();
app.Run();
Events such as logging still only reference the familiar logging library and hold no dependency on specific telemetry implementation such as Application Insights
using Microsoft.Extensions.Logging;

var logger = app.Services.GetRequiredService<ILogger<Program>>();

app.MapGet("/", () =>
{
    logger.LogInformation("Handling request for root endpoint.");
    return "Hello, world!";
});
Dashboards
Dashboards are essential when using OpenTelemetry to collect metrics because they provide a visual representation of the data, making it easier to understand and analyse. They help in quickly identifying trends, anomalies, and performance issues, enabling faster decision-making and troubleshooting. With dashboards, we can monitor the health and performance of our system in real time, ensuring that we can respond promptly to any issues that arise and address any bottlenecks in a timely manner.
- Azure Monitor Workbooks
- Scalable: Dashboards can be created that efficiently query large volumes of data.
- Easy deployment: Dashboards can be deployed as part of other Azure Infrastructure as Code (IaC).
- Limited charting options: Azure Monitor Workbooks offer basic charting capabilities, which might not be sufficient for complex visualisations.
- Complex queries required for advanced charts: Creating advanced charts often requires writing complex Kusto Query Language (KQL) queries, which can be challenging for users unfamiliar with the language.
- Minimal styling and customisation options: Workbooks provide limited options for styling and customising charts, which can restrict the ability to create visually appealing dashboards.

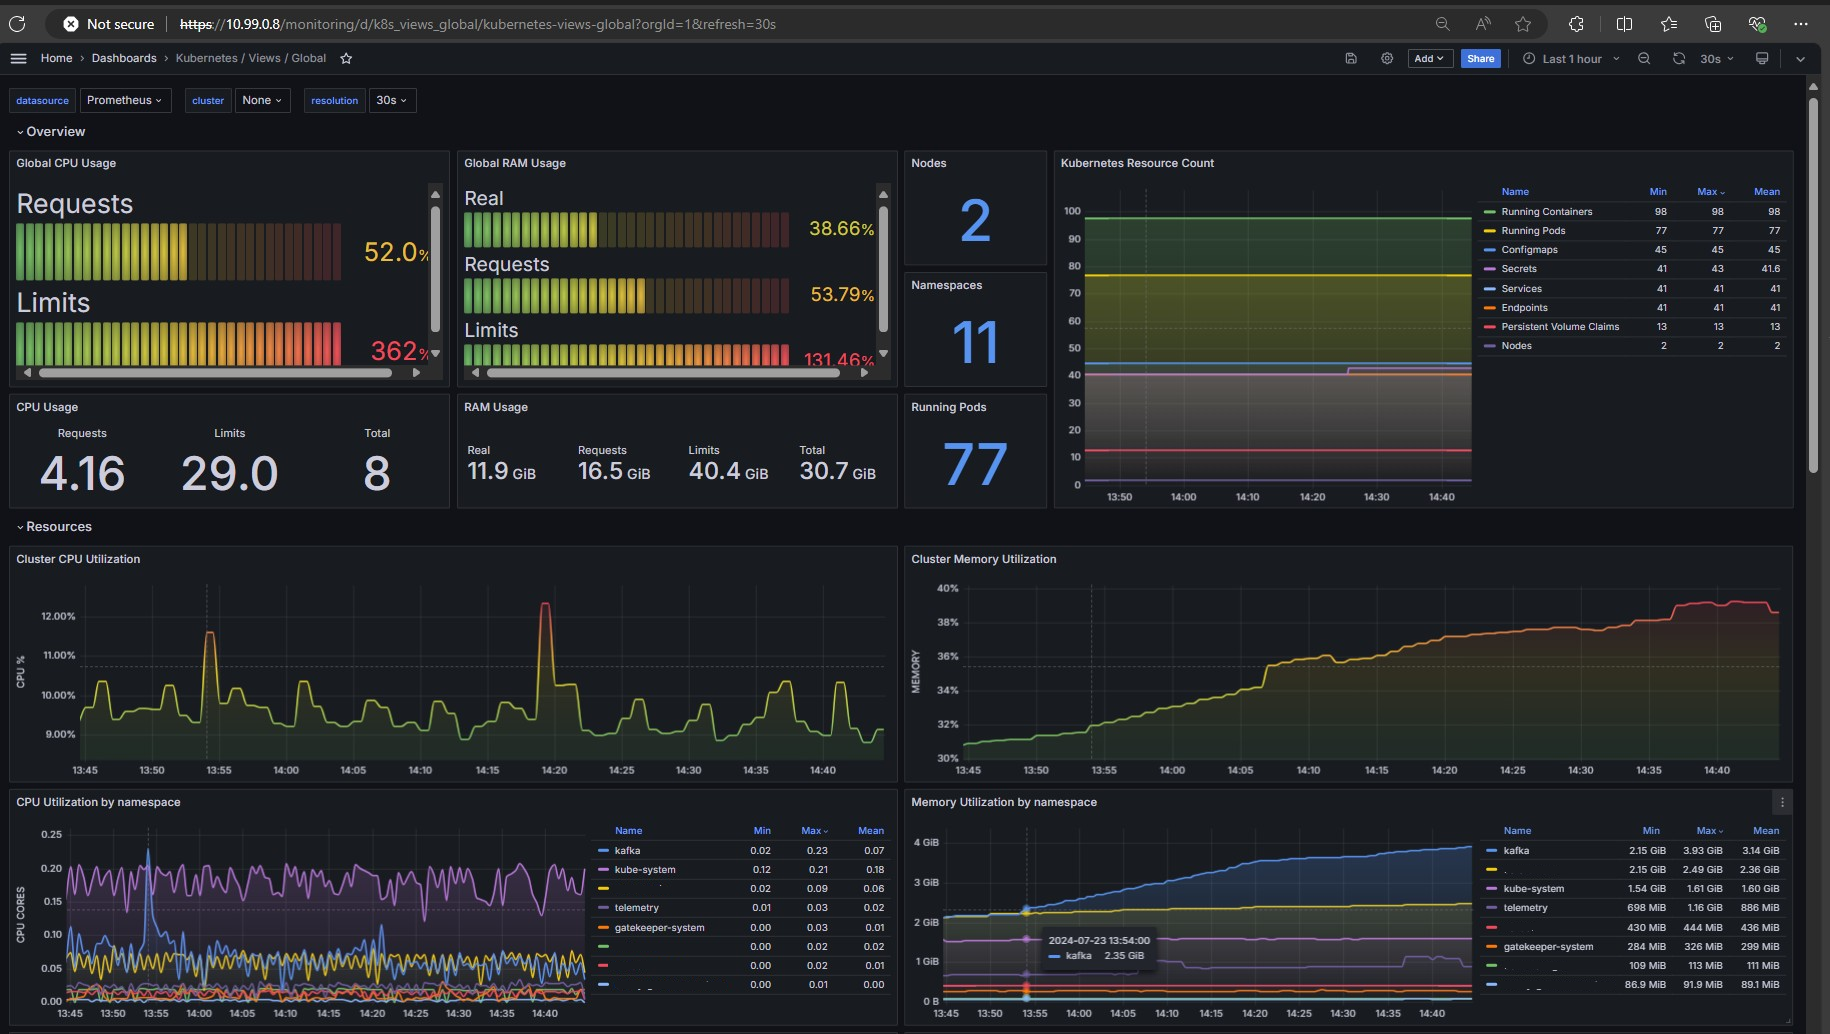
- Grafana Dashboards
- Hundreds of open-source dashboards available: Grafana has a large community that contributes a wide variety of pre-built dashboards, making it easy to find and use existing solutions.
- Easy integration and reuse of existing charts: Grafana supports seamless integration with various data sources and allows users to reuse and modify existing charts to fit their needs.
- Intuitive and flexible chart creation: Grafana’s user-friendly interface and flexible charting options enable users to create complex visualisations with ease.
- Configurable via JSON or configuration files: Dashboards in Grafana can be configured and managed using JSON or configuration files, allowing for version control and easy deployment.
Summary
We successfully addressed the challenge of observability dependencies by incorporating OpenTelemetry, which allowed us to decouple our code from the observability stack. Projects with numerous moving parts benefit from a flexible observability tool capable of handling diverse metrics and logs. Incorporating Grafana into the stack enhances this flexibility, thanks to its robust ecosystem of open-source extensions. For cloud-based solutions, tools like Azure Application Insights offer excellent ease of deployment and scalability, particularly for distributed tracing. However, its limitations in visualization highlight the importance of pairing it with other tools to achieve comprehensive and powerful observability.
The feature image was generated using Bing Image Creator. Terms can be found here.