

Introduction
In our recent engagement, customers wanted to build an application with peak traffic of 6 million requests within a 4-hour timeframe. In order to test the scalability of the application and also to identify performance bottlenecks during its peak traffic, we leveraged the Azure Load Testing service.
Azure Load Testing (ALT) is a fully managed load testing service that enables us to generate high-scale load. The service simulates traffic for the applications, regardless of where they’re hosted. In this blog post, we will describe how to use Azure Load Testing to optimize application performance, scalability, or capacity. We will cover how to create and run load test in ALT and analyze the results once the load test finishes. Also, highlighting the features that impressed us the most.
Create an Azure Load Testing Resource
First, create an ALT resource in the same region where your application is hosted. This is a top-level resource for Azure Load Testing which is a centralized place to view and manage test plans, test results, and related artifacts.
Quickstart: Create an Azure Load Testing Resource using Azure portal
Create and Run a Load Test
ALT enables you to create a load test from the Azure portal by specifying the target web application URL or using an existing Apache JMeter script.
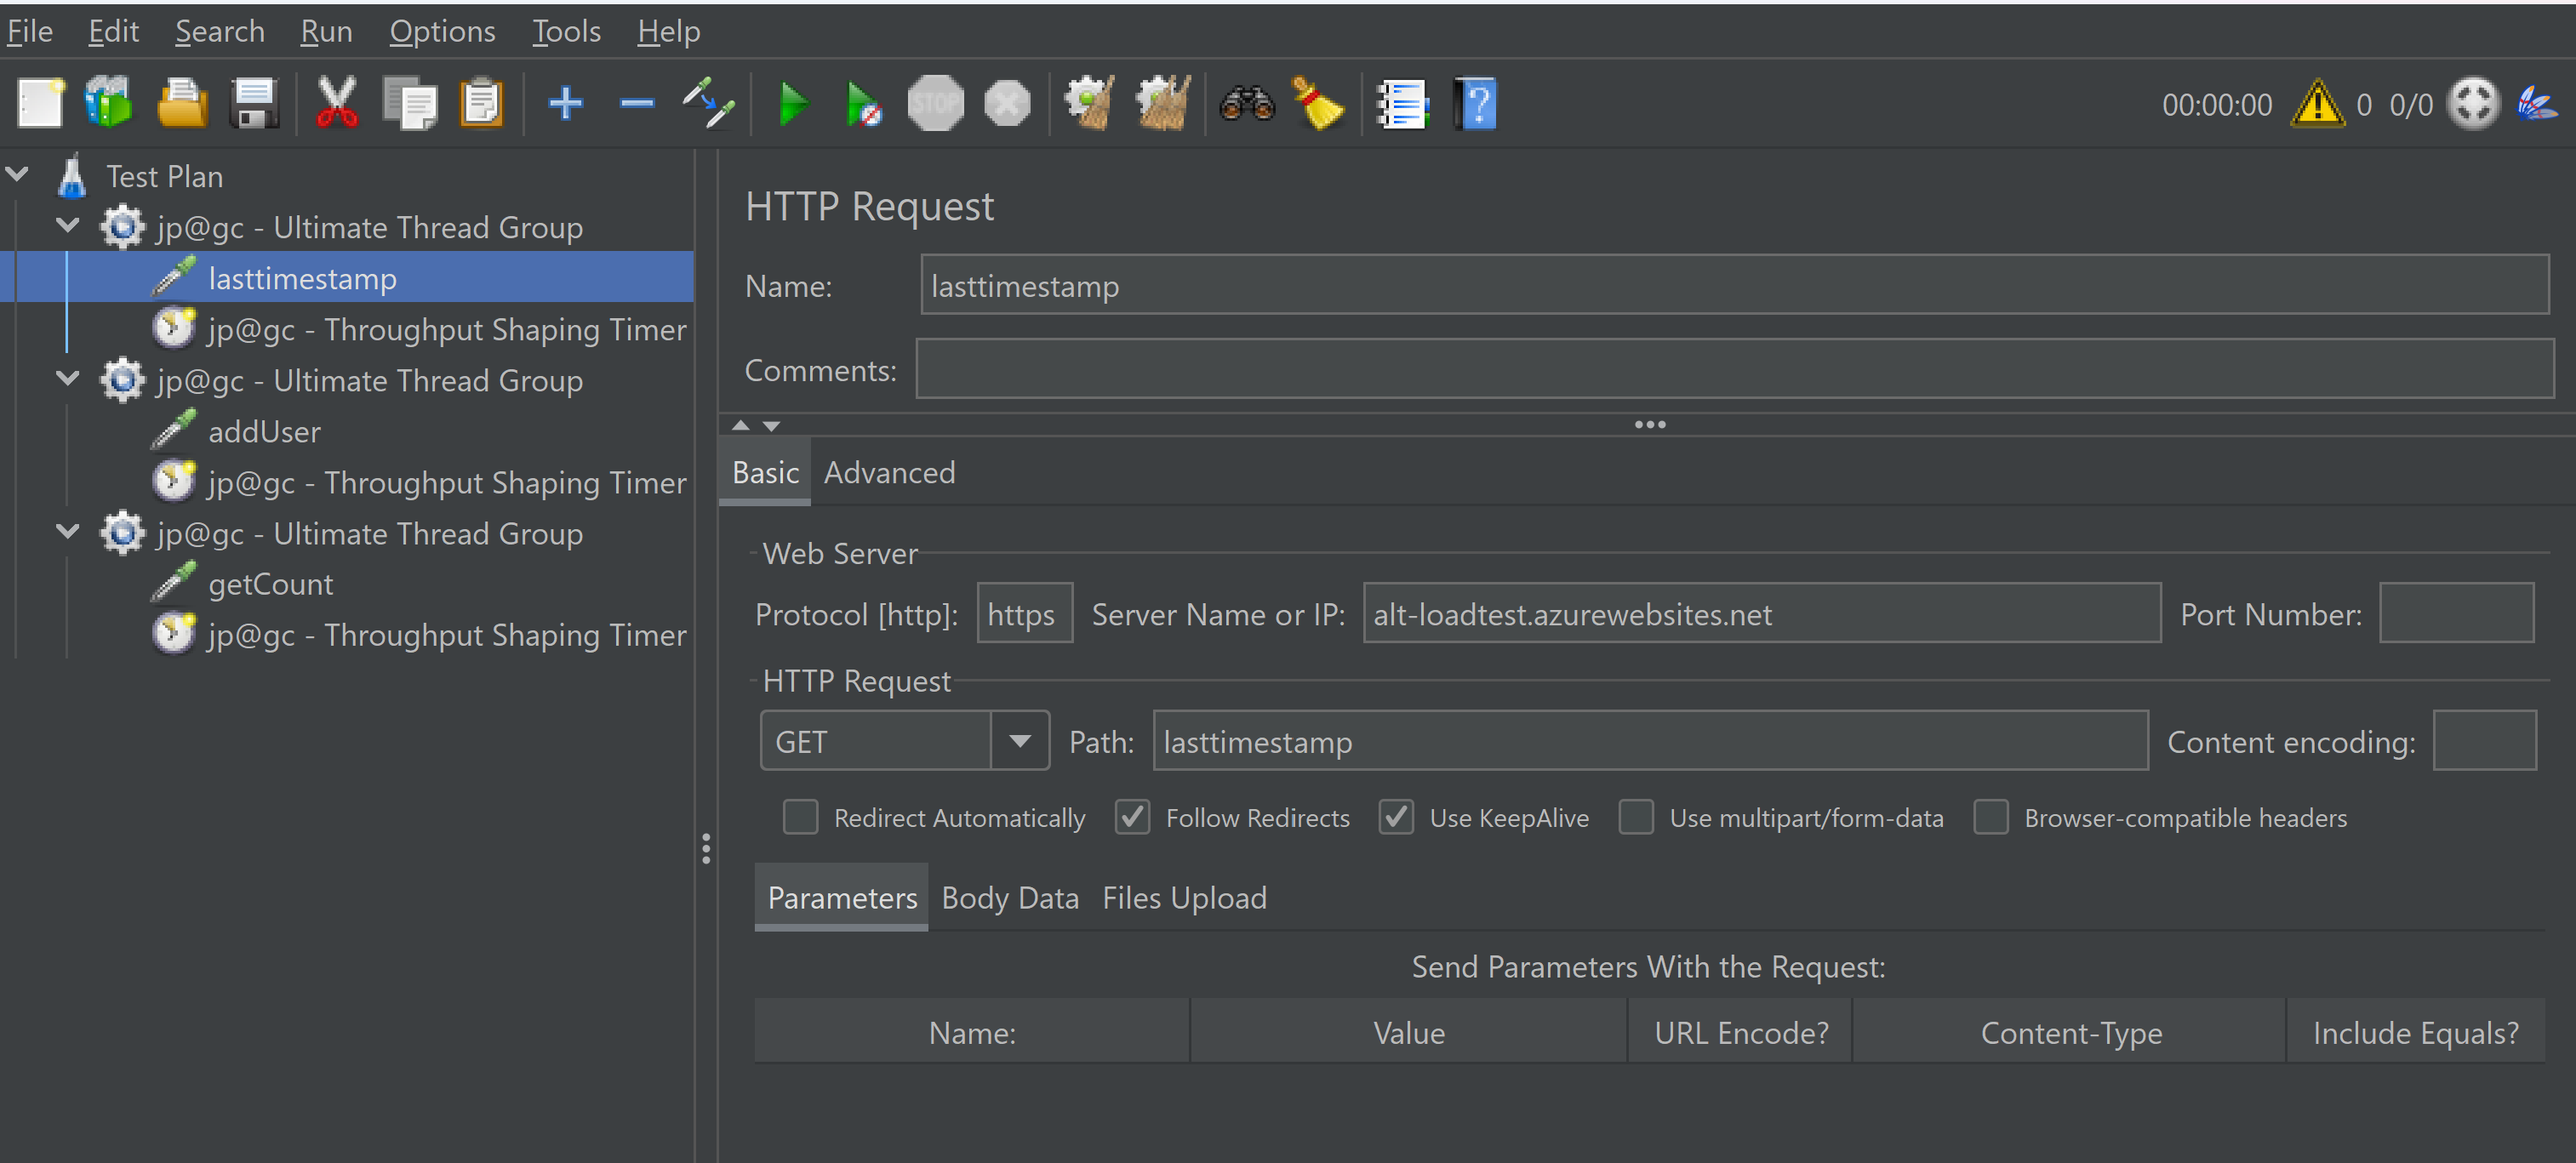
Since we wanted to test multiple endpoints in a single load test, we created a SampleApp.jmx using Apache JMeter GUI. The JMeter script makes three API calls to the web app on each test iteration:
- addUser: Carries out a data insert operation on Azure Cosmos DB for the number of visitors on the web app.
- getCount: Carries out a GET operation from Azure Cosmos DB to retrieve the count.
- lasttimestamp: Updates the time stamp since the last user went to the website.
For creating a load test:
- Go to your Azure Load Testing resource in Azure portal, select Tests from the left pane, select Create, and then select Upload a JMeter script.
- On the Basics tab, enter the Test name and Test description information and select the Run test after creation checkbox to automatically start the load test after creating it.
- Upload
SampleApp.jmxJmeter script in the Test plan tab. - On the Load tab, configure the engine instances i.e. The number of parallel test engines that run the Apache JMeter script.
- On the Monitoring tab, specify the application components that you want to monitor with the resource metrics.
- Select Review + create, review all settings, and select Create.
Once the test starts running, one can see the streaming client-side metrics. By default, the results refresh automatically every five seconds. The charts can be customized by applying multiple filters or aggregating the results to different percentiles.
Analyze Load Test Results
Once the load test has finished executing, we can analyze the results of the load test in the Azure Load Testing dashboard. The dashboard overlays client-side and server-side metric graphs for each run, enabling quick analysis of performance issues. We can examine both the client-side and server-side metrics to determine the root cause of the problem.
Client-side metrics are reported by the test engines. These metrics include the number of virtual users, the request response time, the number of failed requests, and the number of requests per second.
Server-side metrics are available for Azure-hosted applications and provide information about your Azure application components. Azure Load Testing integrates with Azure Monitor, including Application Insights and Container insights, to capture details from the Azure services. The available metrics vary depending on the type of service. For example, metrics can be for the number of database reads, the type of HTTP responses, or container resource consumption.
One can also compare test runs in a load test to identify performance regressions between application builds or configurations and also to identify which application component is responsible for a performance issue, and helping determine the root cause.
How to Optimize Performance and Scalability
When we ran the above SampleApp.jmx test, we observed that the addUser and getCount APIs had higher response times and error counts compared to the lasttimestamp API. To investigate this bottleneck further, we delved into the Azure Cosmos DB server-side metrics since both these APIs involve database access.
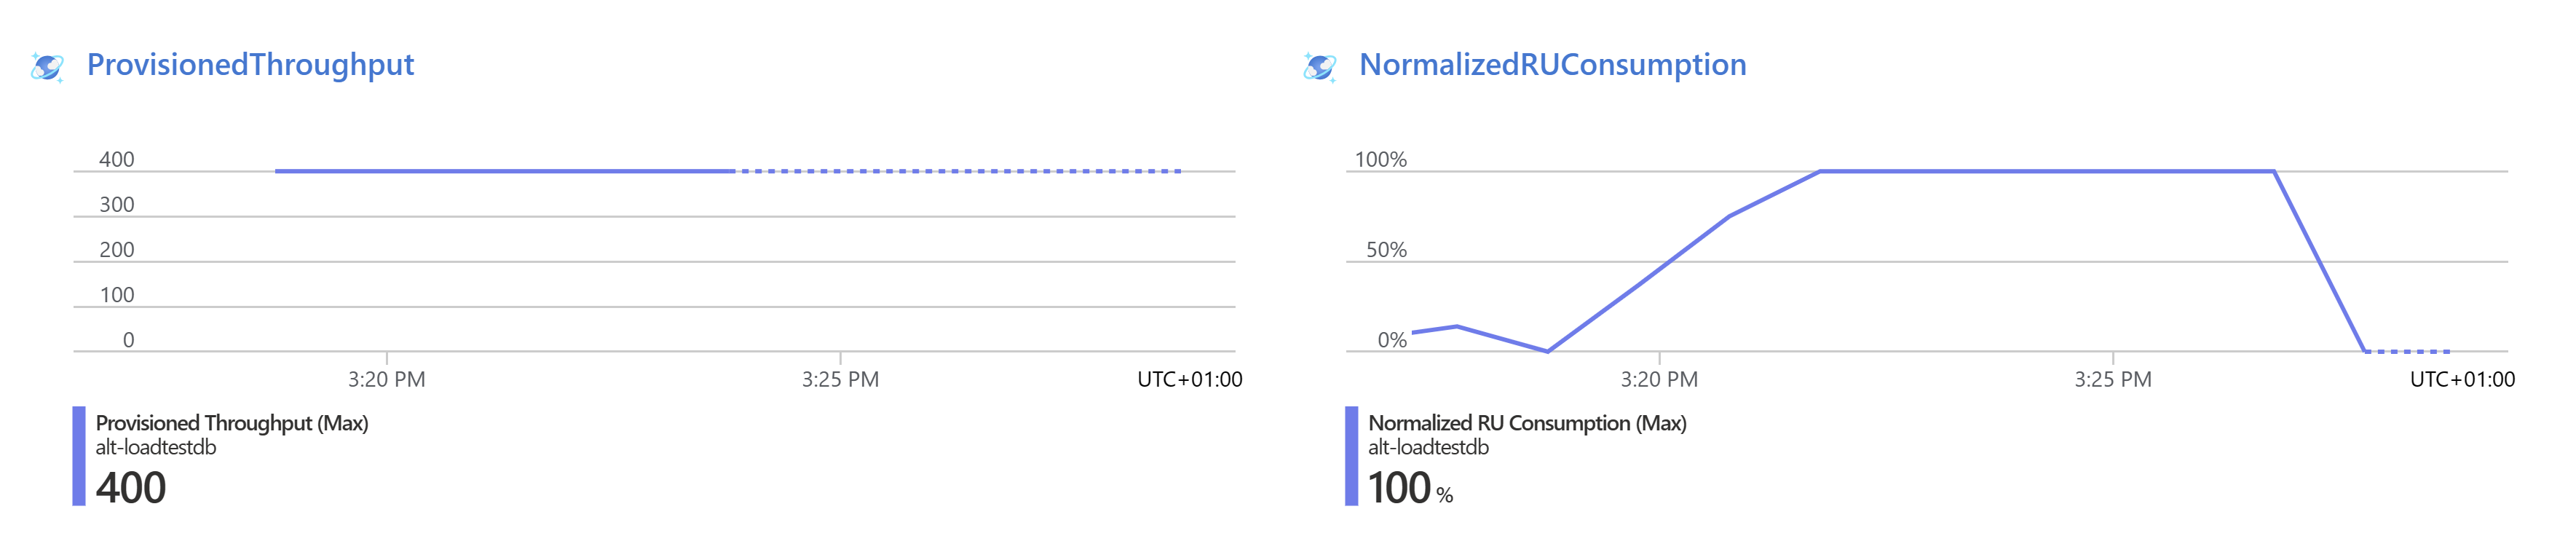
Upon examining the metrics graph, we discovered that the Normalized RU Consumption metric indicated the database was quickly running at 100% resource utilization. This high resource usage likely caused database throttling errors, leading to increased response times for the addUser and getCount web APIs.
Additionally, we observed that the Azure Cosmos DB instance’s Provisioned Throughput metric indicated a maximum throughput of 400 RUs. By analyzing these metrics, we deduced that increasing the provisioned throughput for the database might resolve the performance issue. To address the bottleneck, we decided to allocate more resources to the database and increase the throughput to 1200. Subsequently, we re-ran the load test.
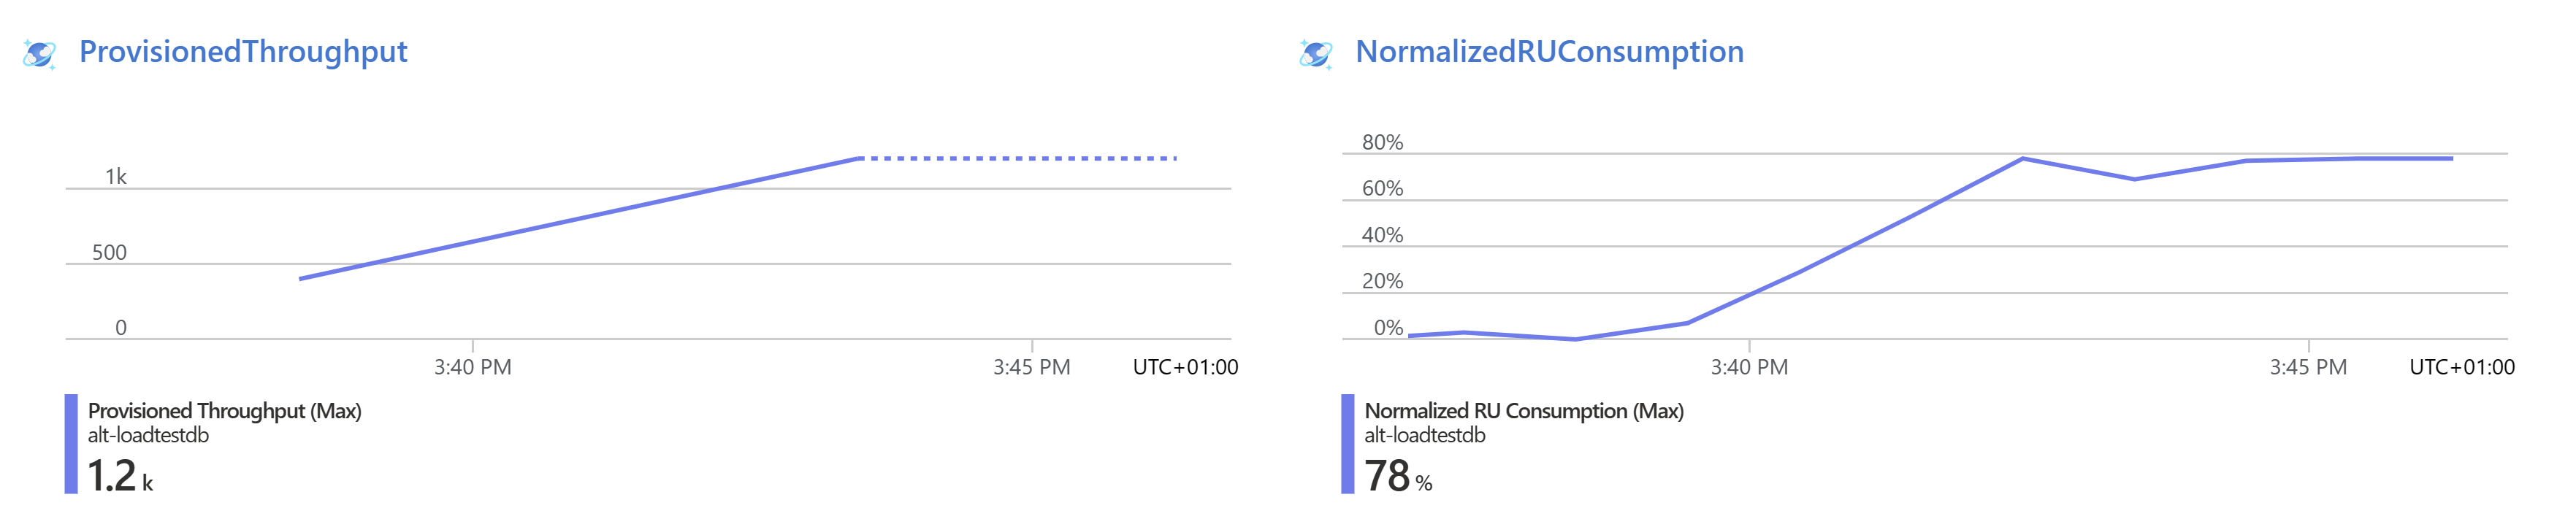
The updated metrics confirmed improved performance results. The Normalized RU Consumption value for Azure Cosmos DB was now significantly below 100%, and the response time for the addUser and getCount web APIs improved as well. Consequently, the overall performance of the application was enhanced.
Key Features
Among the numerous features offered by ALT, we found the following to be particularly useful:
- User-friendly dashboard for client and server metrics analysis The dashboard gives a comprehensive view of curated client and server metrics. For example, it allows us to analyse the performance of Cosmos DB under high load, providing actionable insights into its performance.
- Auto-stop test functionality to minimize expenses ALT automatically stops a load test if the error percentage is high for a certain time window. This prevents incurring costs for an incorrectly configured test. The auto-stop functionality can be customized by adjusting the error rate and time window settings.
- Seamless integration into automated CI/CD pipelines Load testing can be easily built into CI/CD workflows using Azure pipelines and GitHub actions. Clear pass and fail criteria established for load tests can help to catch and block performance regressions early in the development lifecycle.
- Comparison of test runs Multiple test runs can be compared to identify performance regressions. Metrics such as response time can be analyzed to detect performance changes between different load test runs.
- Integration with Azure Key Vault to securely access secrets ALT can access Azure Key Vault using system/user assigned identity, for securely accessing secrets like client id/secret, to be used by the test engine. These can then be referenced in the JMeter script as user-defined variables.
Conclusion
To conclude, Azure Load Testing proves to be a valuable tool in our arsenal when it comes to load testing. It enables us to comprehensively evaluate system performance and scalability by stress-testing applications, thus helping to identify bottlenecks early in the development lifecycle.