The user insights feature is generally available (GA) in Microsoft Entra External ID external tenants. It is accessible via Microsoft Graph APIs, which are currently in beta, or through prebuilt dashboards in the Microsoft Entra admin center. User insights dashboards provide organizations with valuable insights into user behavior and patterns within customer-facing applications. You can query and analyze user metrics such as total user count, monthly active users (MAU), daily active users (DAU), newly added users, authentications, and multifactor authentication (MFA) usage.
Custom dashboards with Microsoft Graph API
The out-of-the box dashboards in the Microsoft Entra admin center provide easy-to-digest graphs and charts but have limited customization options. Microsoft Graph APIs enable you to build powerful, customized dashboards with data tailored to your specific needs and preferences. This has some advantages:
- Flexibility: You can integrate with other data sources to present your data in a way that aligns more with your business objectives.
- Enhanced visualization: You can have richer and more interactive visual representations of your data.
- Complex query handling: You can apply advanced filters, aggregations, and calculations to your user insights data and get more granular and accurate results.
User insights APIs are summarized into daily and monthly data, offering varied insights tailored to different needs:
- Daily APIs: Monitor daily fluctuations in user activity; perfect for recognizing immediate changes, tracking sudden spikes in requests and authentications, or evaluating the impact of daily marketing campaigns and product updates.
- Monthly APIs: Gain a broader understanding of user behavior trends and retention across extended intervals, beneficial for gauging the success of long-term strategies and initiatives.
Example dashboards you can build
- Seasonal trends: Visualizing seasonal trends can help in strategic planning and forecasting. For example, heatmaps showing user activity, sign-ups, or authentications by day of the week or month, can help identify high-traffic periods. This dashboard can help identify patterns and trends in user activity, enabling more effective resource allocation.
- Anomaly detection: This dashboard can show the number and frequency of unusual or suspicious events in your applications, such as failed sign-ins, sign-ups from unknown locations, or spikes in user activity. You can use this dashboard to monitor application security, troubleshoot issues, and respond to incidents.
Build your own user insights dashboard
Let’s explore how to build a customized Power BI dashboard using user insights Microsoft Graph APIs.
Prerequisites
- External tenant – To access user insights data, you must have an external tenant. If you already have an Azure subscription, use this quickstart to create an external tenant. If not, you can sign up for a 30-day free trial here.
- Registered app(s) – User insights collects and aggregates data from your customer-facing applications. Ensure you have at least one registered app with sign-in and/or sign-up activity.
- Power BI – For the purposes of the example in this blog post, we will use Power BI to visualize the data. You can use Power BI desktop or Power BI service. Alternatively, you can choose any other analytical tool you prefer.
Setting up External ID
- Confirm you’re in your external tenant – In Microsoft admin center, go to Identity > Overview > Manage tenants. Confirm your external tenant is the current tenant you’re in.

-
Register an app for authorization – To securely access Microsoft Graph APIs, you need to register an app that will be used to generate access tokens for authorization. Go to Identity > Applications > App registrations to create one as outlined here.
-
Configure API permissions for Microsoft Graph – Add the necessary API permission
Insights-UserMetric.Read.Allto the registered app from step 2. Follow the instructions provided here. Keep in mind that the access token you generate will only be valid for one hour. To manage this, you can create a function in Power Query to check for token expiration and automatically refresh it.
Creating a Power BI report
Once you have successfully set up your tenant, you can now create a Power BI report using custom connectors to fetch user insights data. Here’s how you can connect Power BI to Microsoft Graph and build your report.
Transforming and visualizing data
Power BI comes with Power Query Editor that can help you clean and shape your data. You can remove unnecessary columns, handle missing values, and apply transformations such as merging, grouping, filtering, and many more.
- Transform and model your data – Once you have pulled all the data you need from the user insights APIs, transform and model your data to suit your needs. Go to Home > Transform data to use Power Query Editor.

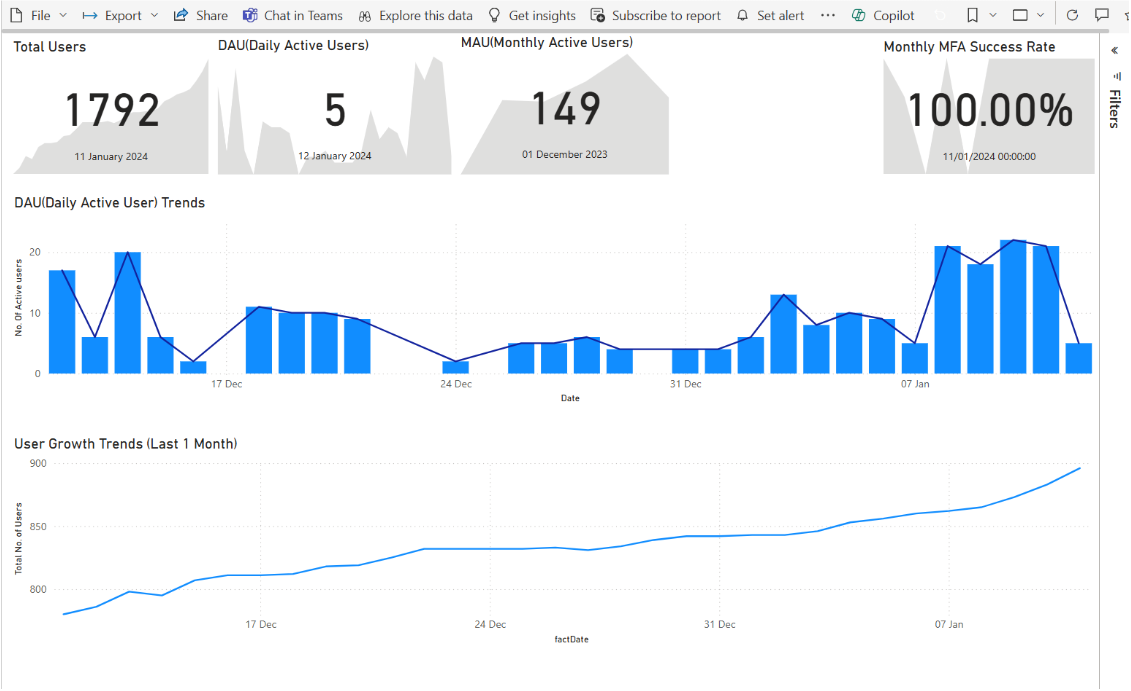
- Visualize your data – Build engaging reports and dashboards once your data is ready for use. Power BI offers a range of visual elements to help you represent your data effectively. The example below shows a summary of user activity with daily and monthly growth trends.

Let’s recap
In this blog post, we explored how to build customized Power BI dashboards using user insights data in Microsoft Entra External ID. We went through accessing user insights data via Microsoft Graph APIs, setting up an external tenant and registered app, and using Power BI to connect to Microsoft Graph and build a report. We covered how to transform and visualize data in Power BI, enabling you to create insightful dashboards that can improve decision-making and security monitoring in customer-facing applications.
Learn more
To test out other features in the Microsoft Entra portfolio, visit our developer center. Sign up for email updates on the Identity developer blog for more insights and to keep up with the latest on all things Identity, and follow us on YouTube for video overviews, tutorials, and deep dives.


0 comments