
Work flow of diagnosing memory performance issues – Part 0
Work flow of diagnosing memory performance issues – Part 1 (this post)
Work flow of diagnosing memory performance issues – Part 2
In this blog post I’ll talk a bit about contributing to PerfView and then continue with the GCStats analysis. You can skip to the analysis part directly if you like.
One of the frustrating things for me when it comes to tooling is there are a lot of memory perf tools out there but very few are targeting the common types of customers I normally work with. Every tool does the basics; very few do intermediate and advanced analysis. I know folks have complained about the usability of PerfView – and I do think some of the complaints are valid. None the less I love PerfView because it’s often the only tool that can get the job done. I hope folks understand that 1) we have very limited resource for PerfView (we don’t have a whole tooling team like in the Visual Studio org; we have part time from a few individuals) so it’s hard to satisfy nearly all user requests; 2) when it comes to advanced analysis, since it can be so diverse, it naturally means the usability is not going to be as straightforward – when there are so many ways to look at things, the permutation quickly becomes very large.
Contributing to something like PerfView is an excellent way to contribute to .NET core. It doesn’t have as steep of a learning curve as the runtime itself but your contribution could potentially save people a ton of time. You can start by cloning the repo and building it. And then you can step through the code – IMO if you could actually step through the code, this is always the best way to understand something new. The code that affects what I talk about here mostly lives in 2 files – src\TraceEvent\Computers\TraceManagedProcess.cs and src\PerfView\GcStats.cs. If you search for things like Clr.EventName (eg, Clr.GCStart, Clr.GCStop), that’s where the events are analyzed (you don’t have to be concerned with the actual parsing the trace part – that’s handled elsewhere). So the GC analysis done in this file is what we call our GLAD (GC Latency Analysis and Diagnostics) library. And GcStats.cs uses it to display what you see in the GCStats view which is an html file. If you’d like to display the GC related info in your own tools, GCStats.cs would serve as an excellent example how to use GLAD.
Continuing the analysis
In the last post we talked about collecting a GCCollectOnly trace and inspecting the GCStats view in PerfView that’s enabled by the GC events collected. And I should note that you can do this on Linux as well with dotnet-trace. From its doc: one of the built in profiles it offers is what’s equivalent to the /GCCollectOnly arg to PerfView’s collect command:
 --profile

   [omitted]

   gc-collect   Tracks GC collection only at very low overhead
You can collect a trace with dotnet-trace on Linux with this commandline
dotnet trace collect -p <pid> -o <outputpath> --profile gc-collect
and view it on Windows with PerfView. The only difference from the user’s POV when you view the GCStats view is, with the trace collected on Windows you will see all the managed processes whereas the trace collected on Linux only has the process with the pid you specified.
In this blog post I will focus on the tables you see in GCStats. I’m showing an example here. The 1st table for a process is the “GC Rollup By Generation” table –
| GC | Rollup | By | Generation | |||||||
|---|---|---|---|---|---|---|---|---|---|---|
| Gen | Count | Max Pause | Max Peak MB | Max Alloc MB/sec | Total Pause | Total Alloc MB | Alloc MB/ MSec GC | Survived MB/ MSec GC | Mean Pause | Induced |
| ALL | 130 | 173.2 | 13,073.7 | 1,131.804 | 4,336.1 | 167,910.9 | 38.7 | 24.686 | 33.4 | 0 |
| 0 | 60 | 51.0 | 12,992.7 | 806.553 | 1,410.8 | 88,958.3 | 0.0 | ∞ | 23.5 | 0 |
| 1 | 62 | 48.3 | 13,073.7 | 422.930 | 1,585.0 | 77,866.1 | 0.0 | ∞ | 25.6 | 0 |
| 2 | 8 | 173.2 | 12,730.3 | 1,131.804 | 1,340.3 | 1,086.5 | 0.0 | 4,169.493 | 167.5 | 0 |
I ignore the Alloc MB/MSec GC and Survived MB/MSec GC columns – they existed before I started working on PerfView and it’d be good to fix these up to have them make more sense but I never got around to.
Now, if you were doing a general analysis, meaning there’s no immediate complaints and you just want to see if there’s anything to improve, you can start with this rollup table.
If we look at the table above, right off the bat we notice that gen2 mean pause is a lot larger than gen0/1 GCs’. We can guess that these gen2s are probably not blocking because the Max Peak MB is around 13GB and if we were to go through all that memory it’s probably going to take more than 167ms. So these are likely BGCs and that’s confirmed by the “Gen 2 for pid: process_name” table below the rollup table (I deleted some columns from the table so it’s not too wide) –
| GC | Pause | Trigger | Gen | Suspend | Pause | Peak | After | Ratio | Promoted | Gen2 | Gen2 | Gen2 | LOH | LOH | LOH |
|---|---|---|---|---|---|---|---|---|---|---|---|---|---|---|---|
| Index | Start | Reason | Msec | MSec | MB | MB | Peak/After | MB | MB | Survival | Frag | MB | Survival | Frag | |
| Rate % | % | Rate % | % | ||||||||||||
| 9101 | 27,487.00 | AllocLarge | 2B | 0.12 | 161.67 | 12,015.06 | 11,955.12 | 1.01 | 6,227.54 | 4,319.97 | 97 | 13.19 | 7,211.27 | 29 | 65.91 |
| 9118 | 152,419.36 | AllocLarge | 2B | 0.1 | 169.81 | 12,153.84 | 12,108.31 | 1 | 6,245.36 | 4,319.97 | 98 | 12.81 | 7,213.29 | 29 | 66.05 |
| 9134 | 269,587.92 | AllocLarge | 2B | 0.061 | 165.74 | 12,730.31 | 11,772.57 | 1.08 | 6,271.16 | 4,319.97 | 97 | 12.35 | 7,142.26 | 29 | 65.67 |
| 9150 | 388,039.73 | AllocLarge | 2B | 0.045 | 161.05 | 12,367.15 | 12,263.51 | 1.01 | 6,255.25 | 4,319.97 | 97 | 12.97 | 7,203.40 | 29 | 65.88 |
| 9166 | 490,877.35 | AllocLarge | 2B | 0.047 | 172.56 | 12,217.70 | 12,180.20 | 1 | 6,255.52 | 4,320.00 | 97 | 12.57 | 7,233.93 | 29 | 66.02 |
| 9183 | 587,126.19 | AllocLarge | 2B | 0.039 | 171.76 | 12,026.77 | 11,921.34 | 1.01 | 6,253.19 | 4,320.00 | 97 | 12.93 | 7,174.79 | 29 | 65.64 |
| 9200 | 688,030.60 | AllocLarge | 2B | 0.132 | 164.5 | 12,472.19 | 12,487.77 | 1 | 6,257.01 | 4,320.00 | 97 | 12.86 | 7,247.72 | 29 | 66 |
| 9217 | 789,274.32 | AllocLarge | 2B | 0.066 | 173.21 | 12,182.76 | 12,200.48 | 1 | 6,268.88 | 4,320.00 | 97 | 12.84 | 7,211.30 | 29 | 65.63 |
2B means generation 2 and Background. If you want to see what other combinations there are, simply hover over the column header that says “Gen” and you will see this text:
N=NonConcurrent, B=Background, F=Foreground (while background is running) I=Induced i=InducedNotForced
So for gen2 this could also be 2N, 2NI, 2Ni or 2Bi. If you are using GC.Collect to induce a GC, there’s 2 overloads that take this parameter –
bool blocking
Unless you specify false for this parameter it means the induced GC is always going to be blocking. That’s why there’s no 2BI.
The rollup table always says there’s 0 induced GCs. But if this is not 0, especially if this is a fairly significant number compared to the total number of GCs, it’s always a good idea to figure out who’s inducing these GCs. This is described in this blog entry.
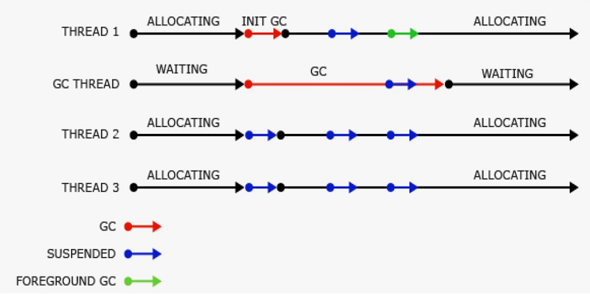
So we know these are all BGCs but for BGC these pauses are very long! Note that I show the pause for BGC as one pause but it really consists of 2 pauses. This picture from the GC MSDN page shows the 2 pauses during one BGC (where the blue arrows are). But the pause time you see in GCStats is the sum of these 2 pauses. The reason was the initial pause is usually very short (the arrows in the picture are merely for illustration purposes – they do not represent how long the time periods actually are). In this case we want to take a look how long each individual pauses are – I’m thinking to just provide the individual BGC pause info in GLAD but before that happens, this is how you can figure out for yourself.
In this blog entry I described the actual event sequence of a BGC. So we are really just looking for the 2 SuspendEE/RestartEE event pairs. To do this you can open the Events view in PerfView and start from the “Pause Start”. Let’s take GC#9217 as an example, its Pause Start is 789,274.32 which you can enter into the “Start” textbox. For Filter type “gc/” to filter to just the GC events, and select the SuspendEE/RestartEE/GCStart/GCStop events and press enter. Below is an example picture of what you would see at this point (I erased the process name for privacy reasons) –
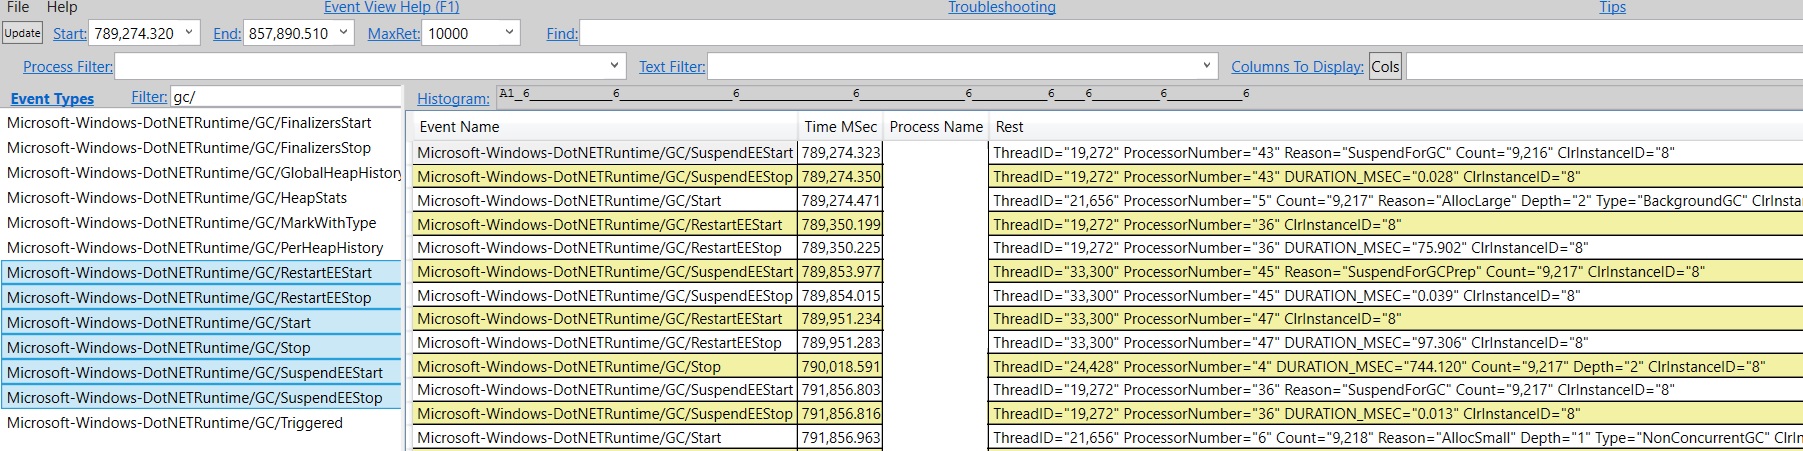
If you select the timestamp for the 1st SuspendEEStart and the 1st RestartEEStop, this is the 1st pause. We can see the status bar of this view shows you the diff of these 2 timestamps is 75.902. That’s very long – in general the initial pause should be no longer than a couple/few ms. At this point you could basically hand this over to me because this is totally not by design. However, if you are interested to diagnose further on your own, the next step would be to capture a trace with more events to show us what’s going on during this suspension period. Usually we capture a trace with CPU sample events + GC events. The CPU samples showed us clearly what the culprit was which was not actually in GC and was in fact something else in the runtime which we have since fixed and this perf issue only shows up when you have many modules in your process (in this particular case the customer had a few thousand modules).
The 2nd pause for this BGC starts with a SuspendEEStart event whose reason is “SuspendForGCPrep”, different from the 1st SuspendEEStart whose reason is “SuspendForGC”. When suspension is done for GC purpose these are the only 2 possible reasons and the “SuspendForGCPrep” is only used during BGC after the initial pause. Normally there are only 2 pauses in one BGC but if you enable events with the GCHeapSurvivalAndMovementKeyword, you will be adding a 3rd pause during a BGC because in order to fire these events the managed threads have to be pauses. If that’s the case the 3rd pause would also have the “SuspendForGCPrep” reason and is usually much longer than the other 2 pauses because it takes long time to fire events if you have a big heap. I have seen this quite a few times when folks didn’t even need those events were seeing an artificially long pause for BGC due to this exact reason. You might ask why would someone accidently collect these events if they didn’t need them. It’s because these are included in the Default when you collect the runtime events (you can see which keywords Default includes in src\TraceEvent\Parsers\ClrTraceEventParser.cs, just search for default. And you can see there are many keywords included in Default). In general I think PerfView’s philosophy is the default should collect enough events for you to do all sorts of investigations. And in general this is a good policy as you may not have another repro. But you need to be able to tell what’s caused by collecting the events themselves and what’s due to the product. This of course assumes if you can afford to collect this many events. Sometimes it’s definitely not the case which is why I generally ask folks to start with lightweight tracing to indicate to us whether there is a problem and if so what other events we should collect.
Another thing we notice from the gen2 table is all of the BGCs were triggered by AllocLarge. Possible Trigger reasons are defined as GCReason in src\TraceEvent\Parsers\ClrTraceEventParser.cs:
public enum GCReason
{
    AllocSmall = 0x0,
    Induced = 0x1,
    LowMemory = 0x2,
    Empty = 0x3,
    AllocLarge = 0x4,
    OutOfSpaceSOH = 0x5,
    OutOfSpaceLOH = 0x6,
    InducedNotForced = 0x7,
    Internal = 0x8,
    InducedLowMemory = 0x9,
    InducedCompacting = 0xa,
    LowMemoryHost = 0xb,
    PMFullGC = 0xc,
    LowMemoryHostBlocking = 0xd
}
The most common reason is AllocSmall which means your allocation on the SOH triggered this GC. AllocLarge means an LOH allocation triggered this GC. In this particular case the team was already aware they were doing a lot of LOH allocations – they just didn’t know they caused BGCs this frequently. If you look at the “Gen2 Survival Rate %” column you’ll notice that the surv rate for gen2 is very high (97%) but the “LOH Survival Rate %” is very low – 29%. This tells us that there are a lot of LOH allocations that are fairly short lived.
We do adjust the LOH budget based on the gen2 budget so for cases like this we don’t triggered too many gen2 GCs. If we wanted to have LOH surv rate to be higher we’d need to trigger BGCs more often than this. If you know your LOH allocations are generally temporary a good thing to do is to make the LOH threshold larger via the GCLOHThreshold config.
That’s all for today. Next time we’ll talk more about tables in the GCStats view.
you are very welcome!