
GC ETW series –
GC ETW Events – Part 3 (this post)
Processing GC ETW Events Programmatically with the GLAD Library
In the last blog entry we looked at a particular GC trigger reason – InducedNotForced GCs. There are 2 other triggered reasons for induced GCs are:
InducedLowMemory – GC subscribes to the low memory notification from the OS and when the OS notifies us that “the memory is low on the machine” a GC is induced; or if this is a hosted process and the host indicates we are low on memory, we also induce a GC.
Induced – this is your “common” case of induced GCs, usually it comes from the user code that calls GC.Collect (as I mentioned in the last blog entry if the user calls GC.Collect and passes false as blocking, it would show up as InducedNotForced).
The other types of trigger reasons are because of allocations. In Using GC Efficiently – Part 1 I talked about the 3 situations a GC is triggered. The most common situation is managed allocations. Out of those reasons the most common you’d see (and want to see) is AllocSmall – this is saying the gen0 threshold is exceeded. If the most common one you see is say AllocLarge it most likely indicates a problem – it’s saying your GC was triggered because you exceeded the threshold for LOH allocating large objects. And as we know that triggers a full GC and keeping triggering full GCs is usually a recipe for performance problems. Other trigger reasons due to allocations are OutOfSpaceSOH and OutOfSpaceLOH – you see these much less frequently than AllocSmall and AllocLarge – these are for when you are close to physical space limit (eg, if we are getting close to the end of the ephemeral segment).
If you looked far enough you’ll notice a table called “Condemned reasons for GCs”. So what is the difference between “trigger reason” and “condemned reason”?
When I first started working on the .NET GC there was lots of confusion as to when/how a GC is triggered. I remember one of the misunderstandings was to explain how a gen2 GC was triggered. The explanation was “GC will do a gen0 GC first; if that’s not enough, it will do a gen1 GC; if that’s still not enough, it will do a gen2 GC”. Well, that would be quite inefficient but it does serve as good context info for explaining the difference between those 2 reasons. “Trigger reason” is how a GC starts or comes into existence. If the most common reason for a GC to start is due to allocating on the SOH, that GC would start as a gen0 GC (because the gen0 threshold was exceeded). Now after the GC starts, we then decide what generation we would actually collect. It might stay as a gen0 GC, or get escalated to a gen1 or even a gen2 GC – this is something we decide as one of the very first things we do in a GC. And factors that would cause us to escalate to a high generation GC are what we called “condemned reasons” (so for a GC there’s only one trigger reason but can be multiple condemned reasons).
For the “Condemned reasons for GC” table it says
This table gives a more detailed account of exactly why a GC decided to collect that generation. Hover over the column headings for more info.
I won’t repeat the info here but you can see the difference between the 2nd column (Initial Requested Generation) and the 3rd column (Final Generation). The former is the generation when the GC is triggered while the latter is after we went through the condemned reasons the generation we landed at. So the former is always <= the latter.
Now let’s take a look at other columns in the GC tables.
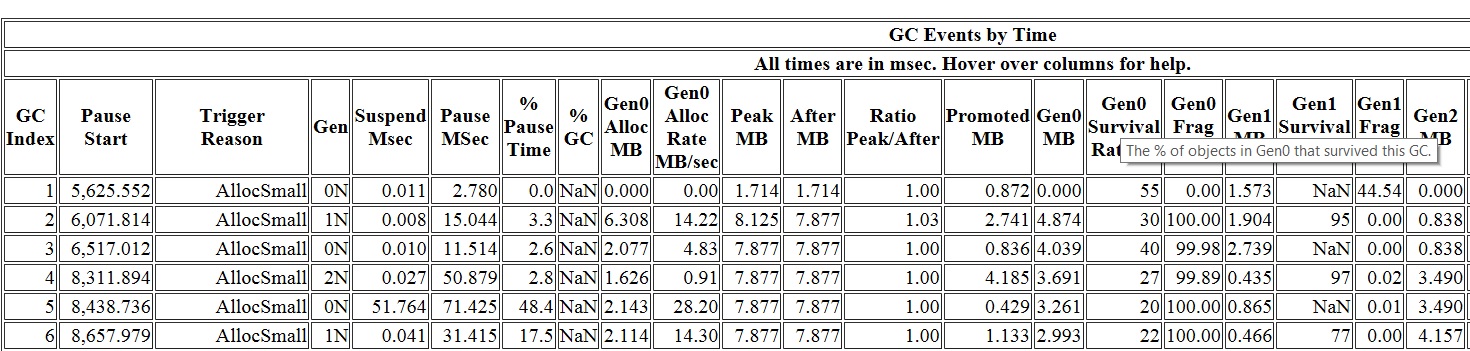
These also have explanations of the columns so if you hover over the column header you will see what that column is for. The next 2 columns interesting to talk about are “Suspend MSec” and “Pause MSec”. The “Pause MSec” column is what tells you how long your threads were paused for due to GC. And “Suspend MSec” is part of this pause (this is usually a small number; if not then that would indicate a problem). Let me explain how these columns are calculated – it’s useful to know because you could incoporate this into your perf automation framework as some of our internal teams do. One very useful thing you could measure with this is for your request latency you can tell exactly how much the GC pause contributed to it (and you can tell for example how often and how much GC pause is the problem for your longest requests).
(suspension and resumption are explained here)
The GC ETW events are documented here. And the relevant ones for pause time are (you can get the event ID and field description on the MSDN page):
GCStart_V1 Event
GCEnd_V1 Event
GCSuspendEE_V1 Event
GCSuspendEEEnd_V1 Event
GCRestartEEBegin_V1 Event
GCRestartEEEnd_V1 Event
In a typical blocking GC (this means all ephemeral GCs and full blocking GCs) the event sequence is very simple:
GCSuspendEE_V1 Event
GCSuspendEEEnd_V1 Event <– suspension is done
GCStart_V1 Event
GCEnd_V1 Event <– actual GC is done
GCRestartEEBegin_V1 Event
GCRestartEEEnd_V1 Event <– resumption is done.
GCSuspendEE_V1 and GCSuspendEEEnd_V1 are for suspension; and GCRestartEEBegin_V1 and GCRestartEEEnd_V1 are for resumption.
The Suspension MSec column is simply (timestamp of the GCSuspendEEEnd_V1 – timestamp of the GCSuspendEE_V1). We don’t give you the time it takes to resume as it’s very, very short. And the Pause MSec” column is (timestamp of the GCRestartEEEnd_V1 – timestamp of the GCSuspendEE_V1) so this requires the longest possible pause introduced by this GC – “longest possible” is because there are threads that are running for part of the suspension and resumption.
However for a background GC it’s quite a bit more complicated. It is explained here:. It shows a background GC with one foreground GC happening during its duration. We know that all foreground GCs are ephemeral GCs which means they all follow the simple sequence we have above. If we add in the suspension/resumption from the background GC itself it’ll look like this:
1) GCSuspendEE_V1 Event
2) GCSuspendEEEnd_V1 Event
3) GCStart_V1 Event <– BGC starts
There might be a gen0 or gen1 GC happening here and if so you’d see this sequence
GCStart_V1 Event <– gen0 or gen1 starts
GCEnd_V1 Event <– gen0 or gen1 GC is done
4) GCRestartEEBegin_V1 Event
5) GCRestartEEEnd_V1 Event <– done with the initial suspension
There might be 0 or more foreground gen0 or gen1 GC happening here and if so you’d see this sequence
GCSuspendEE_V1 Event
GCSuspendEEEnd_V1 Event <– suspension for foreground GC is done
GCStart_V1 Event
GCEnd_V1 Event <– foreground GC is done
GCRestartEEBegin_V1 Event
GCRestartEEEnd_V1 Event <– resumption for foreground GC is done
6) GCSuspendEE_V1 Event
7) GCSuspendEEEnd_V1 Event
8) GCRestartEEBegin_V1 Event
9) GCRestartEEEnd_V1 Event <– done with BGC’s own suspension
Again, there might be 0 or more foreground gen0 or gen1 GC happening here
10) GCEnd_V1 Event <– BGC ends
That concludes our pause data explanation.
Edited on 03/01/2020 to add the indices to GC ETW Event blog entries
0 comments