
Test & Feedback extension allows everyone in team, be it developers, testers, product owners, user experience, leads/managers etc. to contribute to quality of the application, thus making it a “team sport”. It enables you to perform exploratory tests or drive your bug bashes, without requiring predefined test cases or test steps. This extension simplifies the exploratory testing in 3 easy steps – capture, create & collaborate. An overview of this extension is captured in this overview blog of Test & Feedback extension.
In this blog, we will drill into the “Capture” aspect. There are two ways in which this extension captures the data:
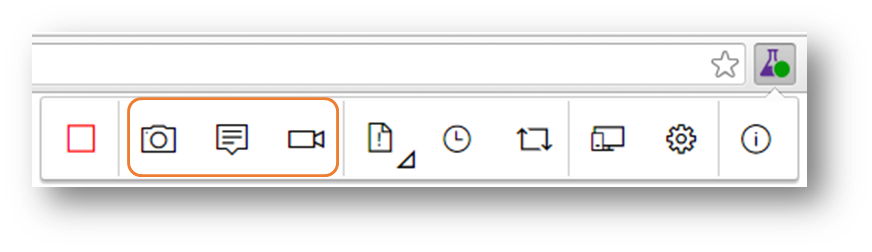
- Explicit capture – With “explicit” capture, actions are required to be taken. All these actions are exposed on extension tool bar. We will cover – Capture Screenshot, Capture Notes and Capture Screen Recording in details below.

- Implicit capture – With “implicit” capture, you are not required to do anything special. Actions triggered by you are automatically capturing required data with basic annotation added. These capture actions include – Image Action Log, Page Load Data and System Information.
Capture Screenshot
As you are exploring the web-app, you can capture the entire screen or part of screen as your screenshot. Click on [ ] to trigger screen capture. Take a “Fullscreen” or capture part of web page as required. Once it is selected, you can annotate the captured screenshot.
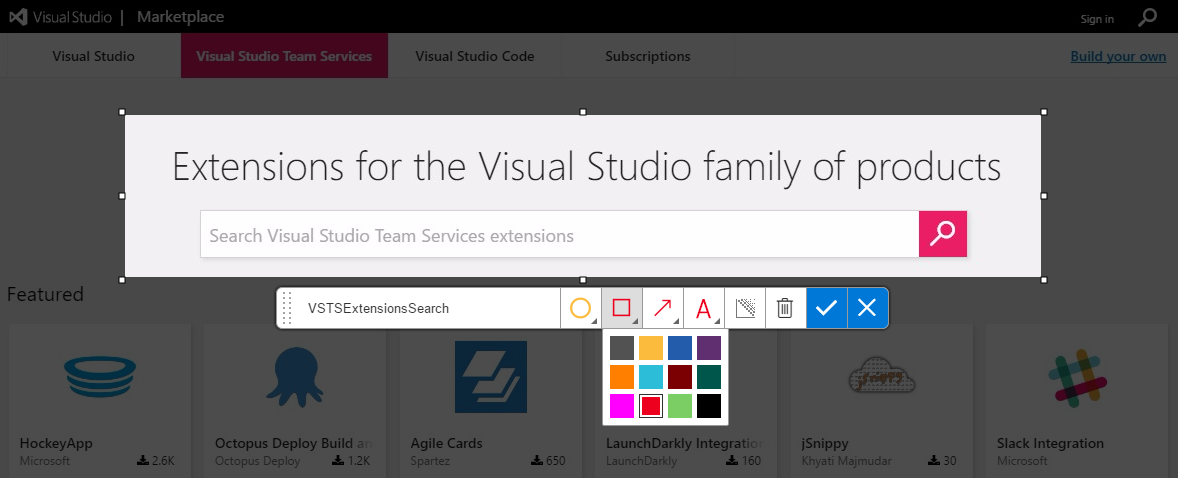
You can select the name of the screenshot you like, and also can use shapes from annotation toolbar to draw on cropped image area to show/highlight part of the page. Annotation toolbar provides – drawing, circles/ovals, rectangles, arrows, and add text annotations. It also provides way to “blur” part of image that has some confidential/sensitive information. You can customize the color for all shapes. Save the screenshot by clicking on [ ]. Saving a screenshot will add it automatically to the session and also shows up on the session timeline.
![]() All floating elements like tooltips, and dynamic UI components that show up on mouse hover and go-away when mouse is moved away, are not captured using the “screenshot” option. You could instead use the “screen recording” option mentioned below.
All floating elements like tooltips, and dynamic UI components that show up on mouse hover and go-away when mouse is moved away, are not captured using the “screenshot” option. You could instead use the “screen recording” option mentioned below.
Capture Notes
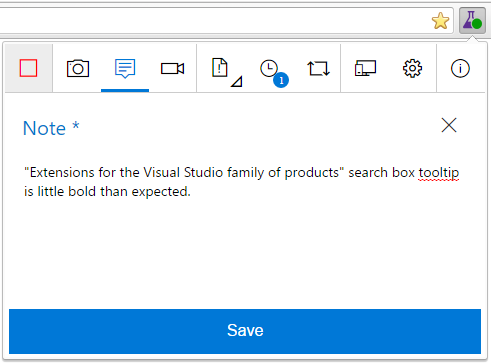
Notes can be taken or made as you explore your web-app. Click on [ ] to open notes area where notes can be added and saved. Notes are saved with the session timeline. You can even paste “text” from your clipboard into notes area. Notes taken are automatically saved, and are persisted even if browser window closes, or the extension pop-up closes. “Save” the note to add it to the ongoing session.
Screen Recording
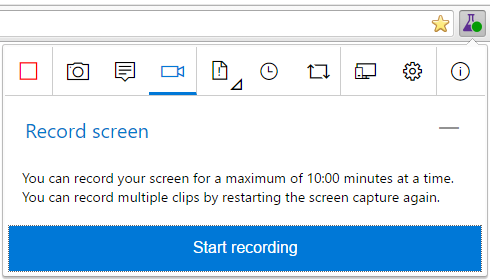
Screen recording allows you to capture more continuous activity of web-page navigation. It is only “video” capture, and “audio” capture is not supported. It also addresses scenario where capturing more events than what image action log can capture or capturing floating elements in web-page (like tooltips) is required. Screen recording can also record the data for all desktop (non-browser) applications as well. This is extremely useful if you are testing a desktop app, but still use the extension to report issues using the screen recording.
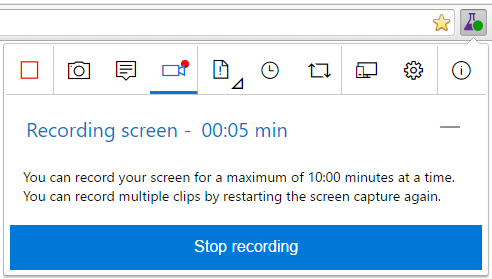
Click on [ ] to start the recoding, and stop recording.
- Start recording

- Select screen or application to record

- Ongoing screen recording status will appear
- Stop the recording when done


Capture Image action log
As you are navigating the web-app, all your mouse clicks, keyboard typing events and touch gestures are captured automatically in the form of “image action log” to give you more context of repro-steps or actions that lead to some specific part of the web-app. Image action log data tracks last 15 events in the context of the ongoing session. Information about captured image action log events is made available during bug and task creation, as well as test case creation. This helps in knowing the steps that led to the bug with just one click at the time of filing it.
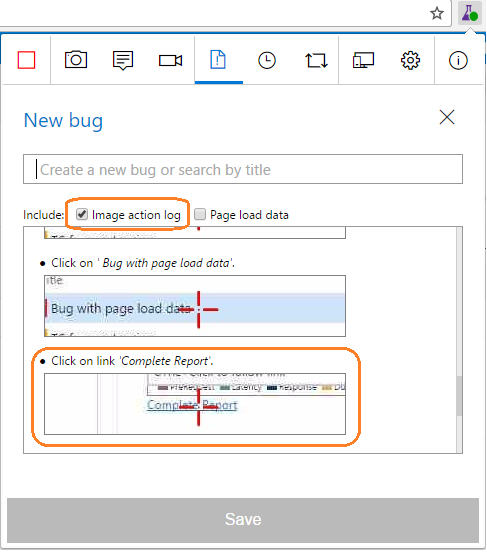
A check-box option allows to include or exclude image action log data during bug filing/task creation. Image action log capture is turned on with the install of extension. Extension “Options” page enables configuration of the image action log option.
In work item form, all image action log images are shown in compact form, but also a full resolution image is added with bug or task for getting complete context. These images are accessible via quick links added in bug repro steps or task description.
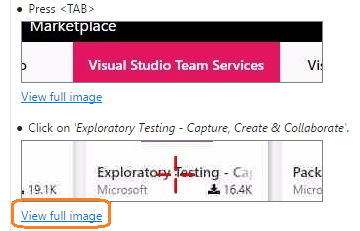 Image action view in work item
They can be seen by clicking on attachment as well.
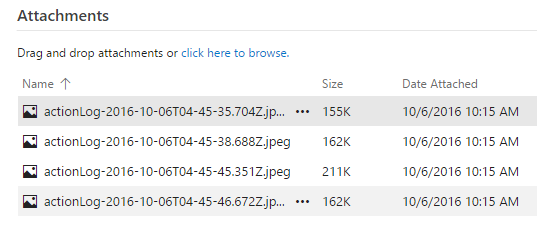 Image action attachments in work item
Capture Page Load Data
Just like the “image action log” captured your actions performed on a web-app being explored, in form of images in the background, the “page load” functionality automatically captures details for a web page to complete the load operation. Instead of relying on subjective/perceived slowness of web page load, you can objectively quantify the slowness in the bug now. Web page load data provides high level snapshot while filing the bug and a more detailed drilldown with timeline graphs added at navigation and resource level in filed bug/task.
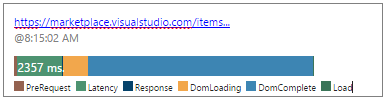
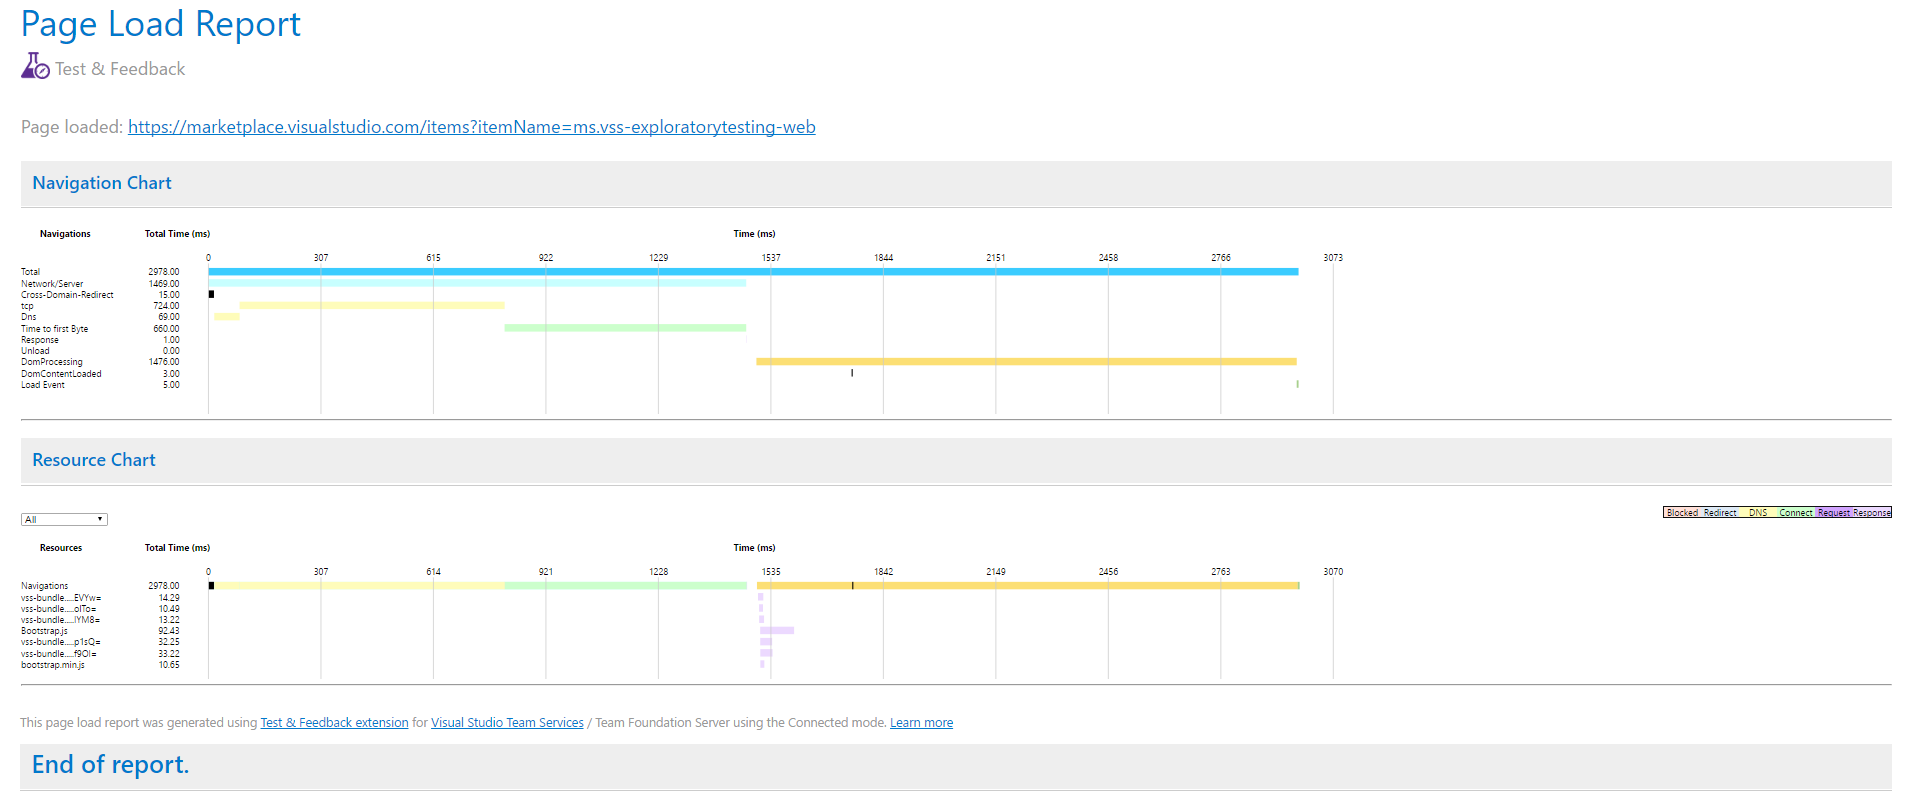
Snapshot provides high level information on where the maximum time is spent while loading the page. A detailed report is attached with bug which comprises of Navigation Chart and Resource Chart. A developer will find this information very useful to get started with deeper investigations about performance issues about web-app.
Option exists with bug and task form to exclude adding page load data when not needed. Also, see extension “Options” to enable or disable this option across of sessions.
System Information
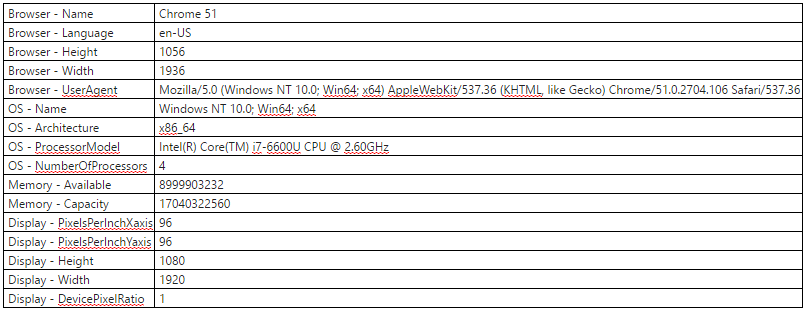
With every bug, task and test case filed, “System information” about the browser and machine is added. It captures browser, OS, memory and display information. This helps developer know the config of machine, display properties and OS info to debug issues. This additional diagnostics information is always sent and cannot be turned off.
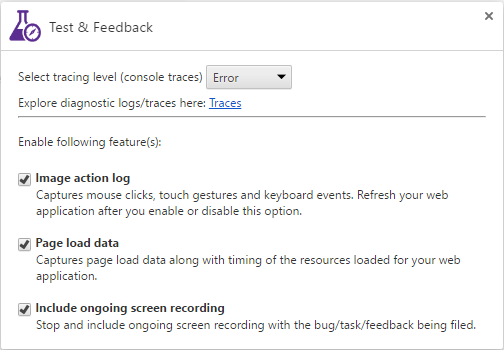
Options
Settings are exposed for all of the above capture sources to enable or disable them at extension level across of all sessions.
Now that you are familiar with all capture ways in Test & Feedback extension, we will explore how can captured data be used in various “Create artifacts” options to create artifacts like bugs, tasks, and test cases.
0 comments