
Over the past little while, the System Center Operations Management team and the Visual Studio IntelliTrace team have been working together to create an increasingly rich debugging experience for applications in production environments. This collaborative effort provides the ability to take Application Failure events from System Center 2012 SP1 and export them as IntelliTrace files for tight integration in Visual Studio Ultimate 2012 Update 2. We also take advantage of the integration with Team Foundation Server using the System Center Management Pack for Microsoft Visual Studio Team Foundation Server 2010 Work Item Synchronization to automatically attach or link to IntelliTrace files from TFS work items.
A complete virtual machine with hands-on-lab is available from Brian Keller’s blog to explore these features and capabilities. You can download just the hands-on-lab / demo script document to see the details or the entire virtual machine to play around with the full experience.
Let’s take a quick lap around the features. Note that the following screenshots are taken directly from the hands-on-lab which goes into much greater detail on how to enable and use the features described in this post.
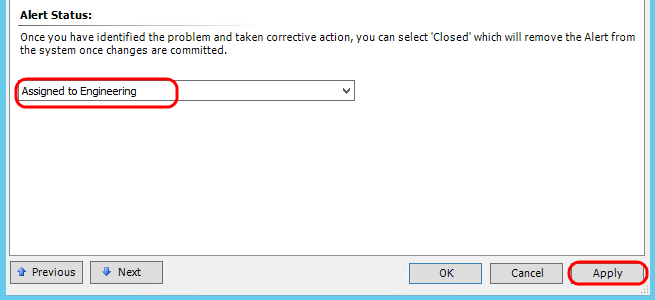
With these new integrated capabilities you are able to assign an Application Error from System Center to the development team using the TFS connector by opening an error alert and selecting the “Assign to Engineering” option from the Alert Status menu.
Once an alert has been “Assigned to Engineering” an Operational Issue work item type is created in Team Foundation Server. By default an IntelliTrace file is linked to the work item. This IntelliTrace file was created based on the data gathered by System Center as part of creating the Application Error alert and adds no further impact to the monitored application. Clicking on the linked IntelliTrace file will allow you to open the file in Visual Studio Ultimate and see the error that happened on the monitored server.
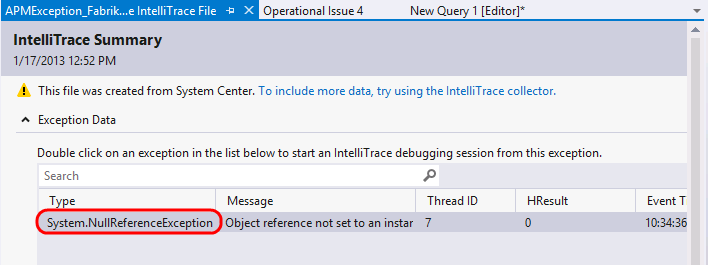
You can now use the IntelliTrace capabilities within Visual Studio Ultimate to dig into the details of the error and jump directly to code where possible. Note, to jump to code you need to ensure that there is indeed user code on the call stack and that you have the matching symbols and source code available to Visual Studio. To understand how Visual Studio, symbol files and source code all relate to the best possible IntelliTrace experience refer to Ed Blankenship’s excellent blog post on the subject.
In addition to the automatically created IntelliTrace files for Application Failures, System Center 2012 SP1 also includes the ability to enable full IntelliTrace data collection to solve those extremely challenging problems. By selecting an existing alert you can enable full IntelliTrace collection using the tasks panel.
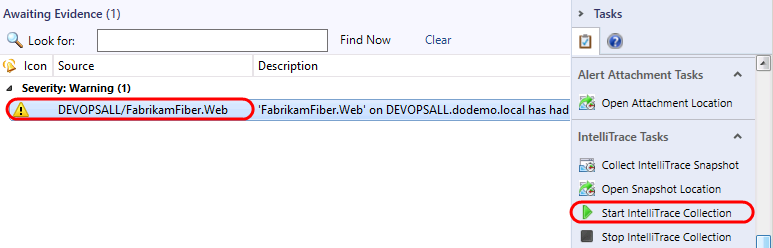
This capability enables operations teams to easily switch on full IntelliTrace data collection to capture rich and detailed data about the problem application. When the IntelliTrace snapshot is taken it is automatically linked to an existing work item that may have been created for the alert. If no work item had yet been created you can use the workflow described above to assign the alert to engineering to create the work item.
If you aren’t using the Team Foundation Server integration the IntelliTrace files are stored to a local server directory that is configured with System Center.
To explore these capabilities further take a look at the hands-on-lab / demo script as well as the virtual machine provided by Brian Keller on his blog.
0 comments