In Visual Studio 2013, we introduced a way to analyze .NET Memory with Visual Studio. Now in the Update 2, we’ve added a new feature to inspect values of objects and instances to improve your diagnostic capabilities. You can follow along using the same code and dumps from the SampleLeak App we had in the previous walkthrough.
If you are using Managed GCDumps in DiagSession files from Application Insights for Azure (like from this blog post), you will not have heap to inspect Instances and Values. This feature requires dumps with heap to have the information required for object inspection.
Instance View
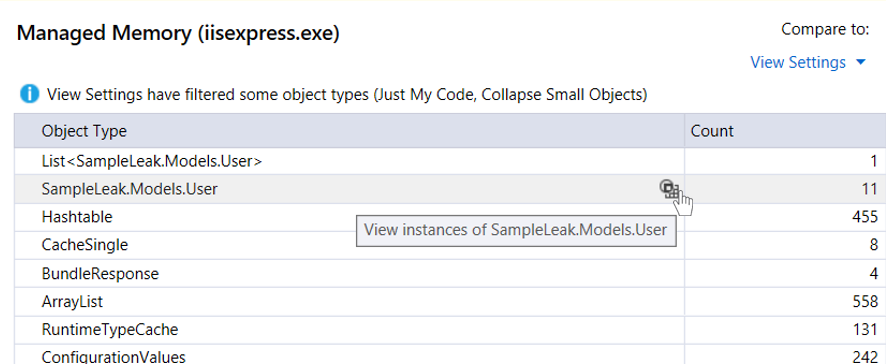
While on the type summary page, we no longer show a drop down expansion of instances in a type. Instead we pop an icon to enter the new instance view. You can enter this view by clicking the icon or pressing Enter.

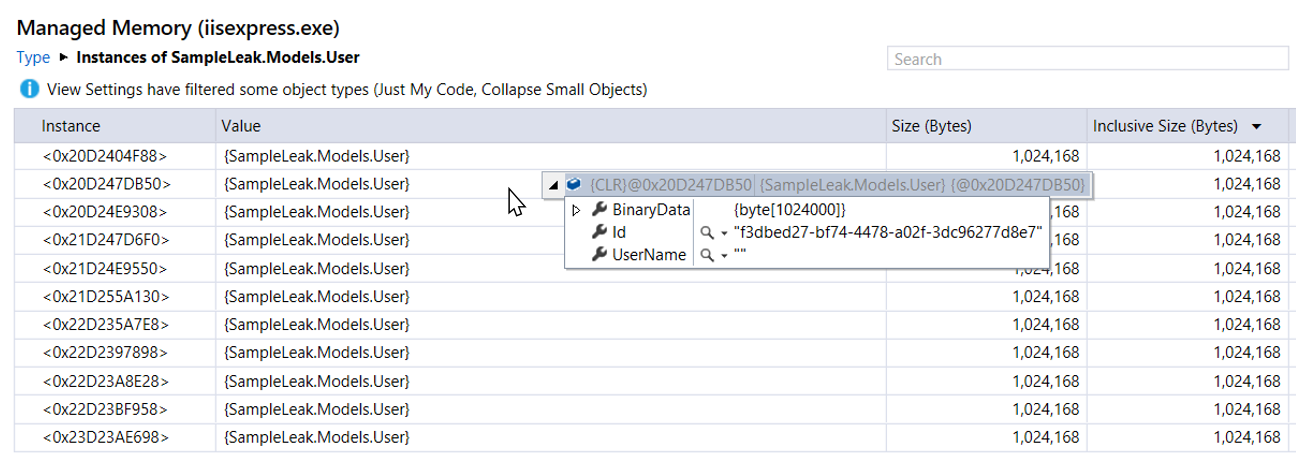
This opens up a new instance view for you to dig deeper into your dump. You can edit the default value shown (instead of just the Type) by adding a DebuggerDisplayAttribute to your code. Hovering over items will pop a DataTip to inspect the values for those instances. You can expand down the objects to inspect the data in the subfields. If you want to dig deep down without a DataTip, you can enter into Quick Watch by pressing Enter with the entry selected or through the context menu.
With this inspection, you can see that all the User entries contained the same Id (your cache isn’t working as expected and you’re creating duplicate entries) and that BinaryData is containing an excessively large bulk of the allocation of the User object.

This also applies in the Paths to Root and Referenced Objects graph at the bottom.

To return to the previous type overview, you can either select Type from the breadcrumbs at the top or hit the Back button or your Backspace key.
In Closing
With the addition of these enhancements, we hope these new features will give you more insight to what’s happening inside your .NET Memory dumps. If you wish to know more about .NET Memory Analysis in general, please revisit our two previous blog entries on the subject. If you have any questions or comments, please leave them in the comments below or in our MSDN forum.

0 comments