I have had several folks ask me how to monitor custom performance counters in Application Insights.
Since I hadn’t played with performance counters in a while I thought I would go through the MSDN documentation on this topic from end to end.
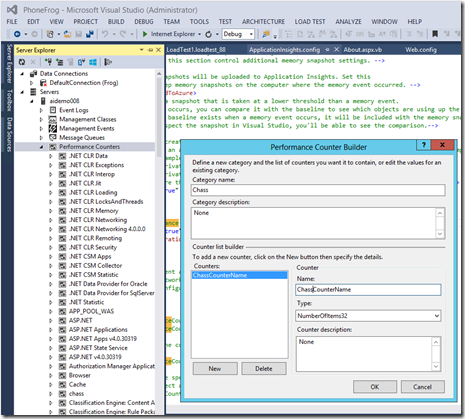
Step 1. Create the performance Counter
In Visual Studio open Server Explorer, expand the Performance Counters node and right click “Create New Performance Category”

Step 2. Create an Application that increments the counter
In Windows Forms you can just drag the performance counter to the design surface but it is not much harder in a Web Application.
Here is the code for Visual Basic:
Dim PerformanceCounter2 As System.Diagnostics.PerformanceCounter = New System.Diagnostics.PerformanceCounter()
PerformanceCounter2.CategoryName = “chass”
PerformanceCounter2.CounterName = “ChassCounterName”
PerformanceCounter2.MachineName = “aidemo008”
PerformanceCounter2.ReadOnly = False
PerformanceCounter2.Increment()
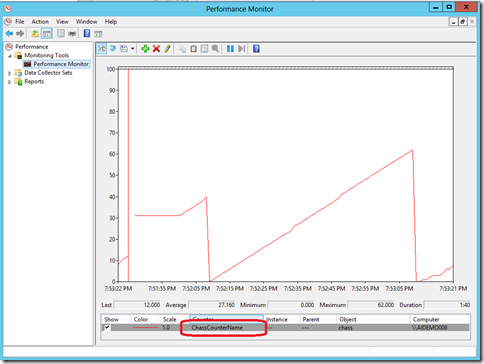
At this point you should be able to see your application increment the counter in Perfmon.

Step 3. Add the performance counter to your Application Insights Configuration File.
To add these entries open your Applicationinsights config file in your solution. This assumes you are using the Application Insights Tools for Visual Studio; these entries have the format “categorynamecountername”.
More information can be found in MSDN documentation on this topic

0 comments