The Microsoft Monitoring Agent allows you to collect reliability performance data and exception data for web applications. You can use IntelliTrace to review this data, or debug this data to get more useful information. In this post I am using MMA Standalone, as opposed to MMA connected to AppInsights or System Center.
One of my colleagues deployed FabrikamFiber site to her local IIS and monitored it with MMA standalone. FabrikamFiber was designed to contain bugs and surprises. Let’s see what we can find from the collected log (attached to the blog).
Open the FabrikamFiber log file in Visual Studio and you’ll see a summary page as following. It’s complaining that some MVC pages have performance alerts and there are also quite a few exceptions. Note that all the exceptions and performance violations are nicely grouped:

Debugging an Exception Data
You can select an item in Exception Data then click the “Debug Newest Exception in Group” button to start debugging this exception. Once the debugger goes into break mode, you are immediately presented in the IntelliTrace window of all the IntelliTrace events collected by the MMA standalone sorted in time order. The expanded event corresponds to the exception that you just started debugging from.
The way Microsoft Monitoring Agent works is it monitors a web application in the background and collects data when undesirable behavior occurs, such as problematic exceptions or poor performance. The collected data includes information about various framework components such as System.XML, ADO.NET and ASP.NET. This information isn’t visible on the IntelliTrace summary page but is available in the IntelliTrace window when debugging:
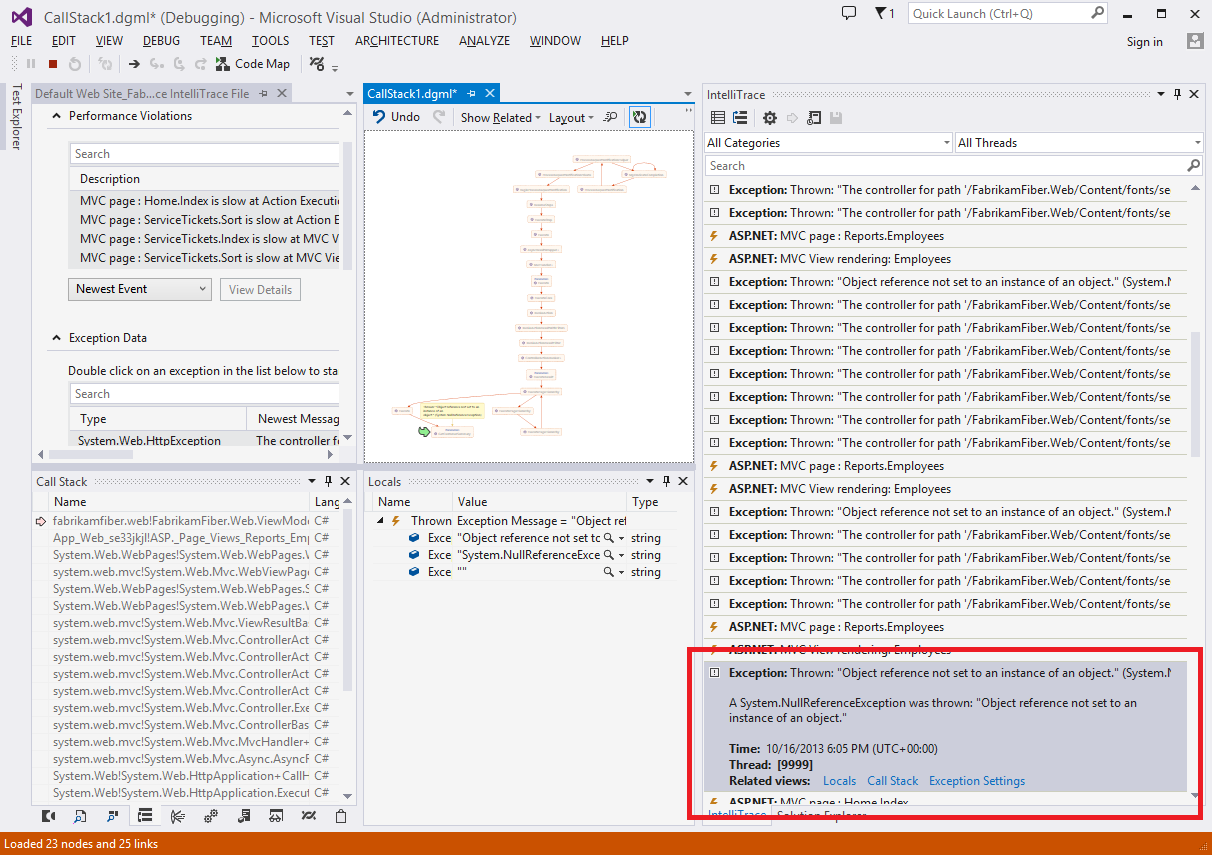
Each event in the list contains an event type and a short description. Currently the following types are supported by Microsoft Monitoring Agent:
- Ado.NET
- ASP.NET
- Azure
- BizTalk
- Gesture
- Reporting Services
- Service Model
- SharePoint
- Performance
- Workflow
- Xml
You can select an event to expand it and see additional information. An expanded event will contain a long description, a time stamp, as well as links to other debugger windows like the Locals window and the Call Stack window. In this case, the Locals window and the Call stack window will also be populated with data from the current event.
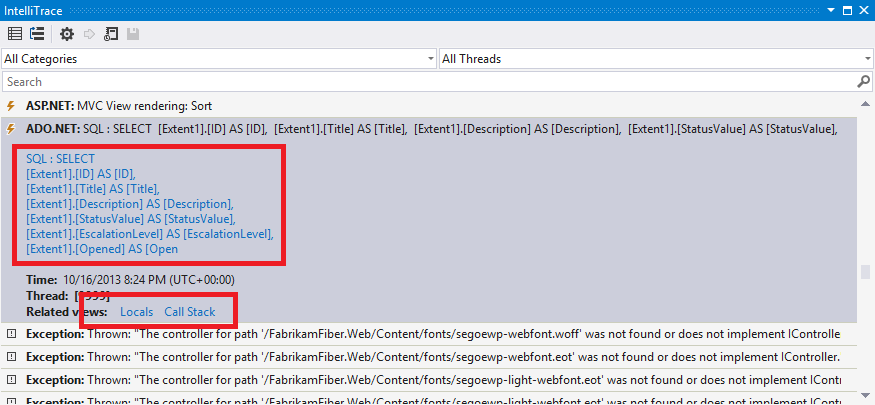
For ADO.NET event, you can even click the link and open the event detail in SQL editor, the same as Jump to SQL from performance detail view:
How the IntelliTrace Events Window Helps Troubleshooting
Knowing what’s in the IntelliTrace window, now let’s see how to use this information to troubleshoot the 3 groups of exceptions on the summary page.
Let’s start from debugging the exception that happened most (58 occurrences as we saw on the Summary page):
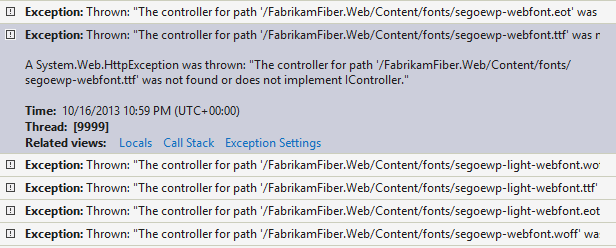
The expanded event says *“The controller for path ‘/FabrikamFiber.Web/Content/fonts/segoewp-webfont.ttf’ was not found or does not implement IController.” *This is a bit confusing because there is no controller created for font files in FabrikamFiber. However if you are familiar with this ASP MVC error message, you’ll realize that what the message really saying is it can’t find the *segoewp-webfont.ttf *font file. After comparing the original code and published web site, it turned out that the font files were not published along with other binaries from my source code folder to the local IIS folder, and the web page failed to access the font files at runtime. I have to say that even though the error message isn’t extremely intuitive, it’s actually really helpful that MMA standalone reported this issue. Because the backup font is so similar to the missing one and it’ll take me much longer time to notice that the font is off on published site without this message.
Now let’s debug the 2nd exception (5 occurrences) which is System.NullReferenceException:
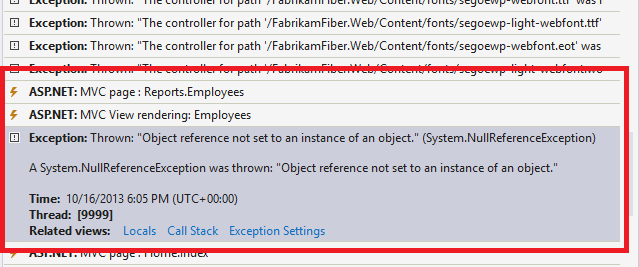
After digging a little bit, I noticed that the two events before this exception event both happened at same time (6:05 PM) as the exception event, and they point to Report.Employees page; which means it’s very likely the NullReferenceException happened when generating the Employees page.
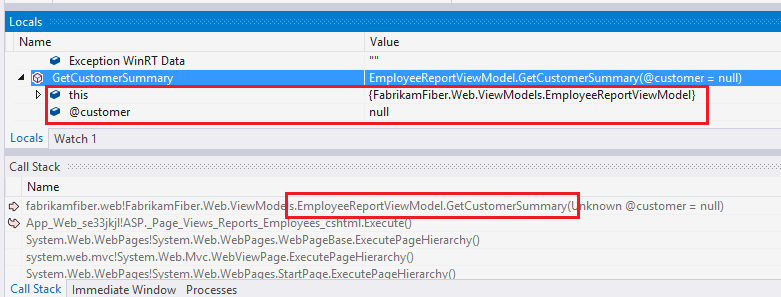
Actually when the exception event is selected, the Call stack window and Locals window also clearly tell us that “EmployeeReportViewModel.GetCustomerSummary” function’s “customer” parameter is null. With this information, I was able to fix the issue quickly later when I got access to the source code.
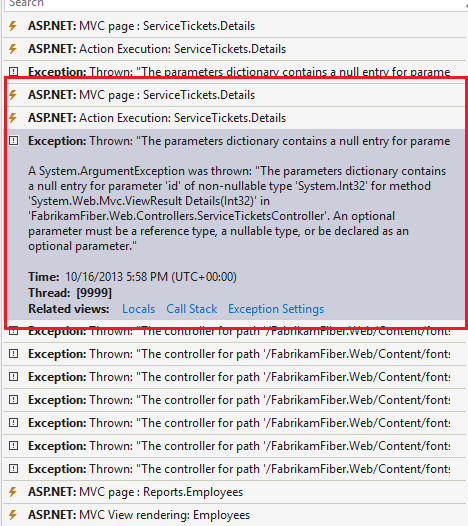
And the understanding of the last issue is similar to the 2nd one, accessing ServiceTickets.Details page caused an ArgumentException.
I’m really glad that with the help of MMA Standalone log, I can easily find and fix these issues on a published site without live debugging the site.
Debugging a Performance Violation
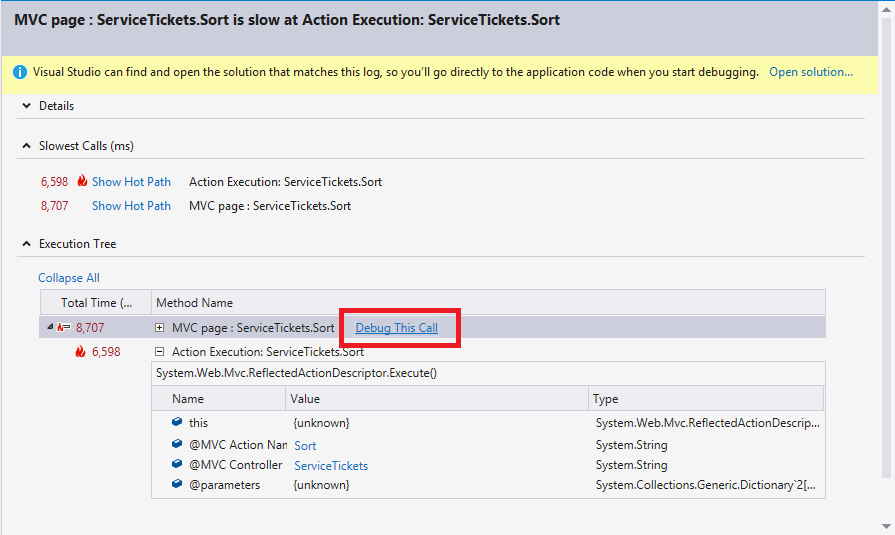
For performance violation data, you can also open the performance detail view and start debugging by clicking the “Debug This Call” link:
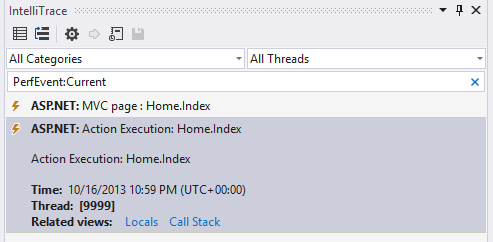
Event better, note that when started from a performance violation item, you’ll see a much shorter list of events because it is filtered to the events related to the current performance violation. You can read more on another blog post how to troubleshoot from a performance alert.
In Closing
We hope you find these features in the Visual Studio IntelliTrace experience for MMA Standalone-sourced IntelliTrace files useful. For feedback on this or any IntelliTrace feature, please ask us at our diagnostics MSDN forum.

0 comments