The Microsoft Monitoring Agent allows you to collect reliability and performance data for web applications and to review the data using IntelliTrace. For Microsoft Visual Studio 2013 Ultimate, Update 2, we have added the ability to easily navigate to Actions and Controllers for Model View Controller (MVC) web sites. Let’s examine that experience in this blog post.
Summary Page
For this example, assume that I have collected data using the Microsoft Monitoring Agent for my MVC application. I open up the resulting IntelliTrace file in Visual Studio, open the associated solution and on the summary page I can see some performance violations (BTW, we now have grouping for events as you can see).

I double-click on the first row to investigate the newest event in the group.
Details Page
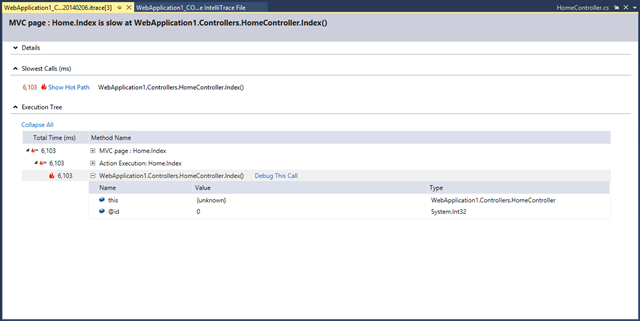
The details page for the event shows the slowest Hot Path for the event. In this case we can see the HomeController.Index() method is slow.

I might choose to ‘Debug This Call’, but instead let’s explore the new MVC-specific functionality in VS2013 Update 2, by expanding the first row – we see that next.
Exploring MVC Actions and Controllers
When we expand the ‘MVC page : Home Index’ row we see links for the action (‘Index’) and the controller (‘Home’). Clicking on the ‘Index’ hyperlink shows all the action methods named ‘Index’ (or tagged with the ActionNameAttribute ‘Index’) in the current solution that are in classes named ‘HomeController’, which also inherit from the MVC Controller class as per the following screenshot.

In the screenshot example above, I hovered over one of the actions to also see a source code preview.
I can also click on the ‘Home’ controllers link and see the list of controllers call ‘HomeController’, that inherit from MVC ‘Controller’. In this example, I have 3 controllers and I hover over one to see a source code preview.

While seeing this data is cool, at some point I will want to pick one and go to source – let’s look at that next.
Navigation to source
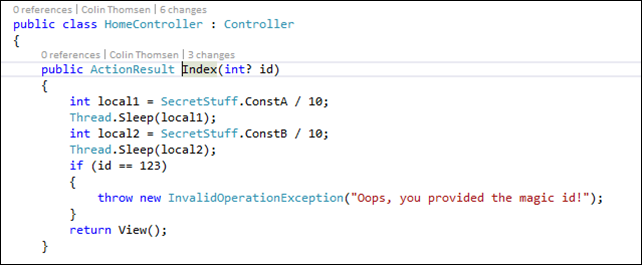
From either list, I can double-click to navigate to source. For example, double-clicking on the ‘Index’ action takes me here:

If you don’t have the solution open, clicking on actions or controllers will show the following:

You just need to open a solution to fix this issue.
Also if you haven’t built your solution, a warning may show and your results may not be complete, as shown below – you can fix that by building your solution.

Prerequisites: Source, but not necessarily symbols
Note that these code navigation scenarios work even if the solution you have open when the itrace file is opened does not exactly match what is deployed. This is in contrast to typical debugging source code navigation, where symbols (PDB files) are required in order to navigate to source. If you want to be sure that code you are viewing does exactly match the deployed code, you may use ‘debug this call’ for a given row on the Performance Details page.
In Closing
We hope you find the ability to quickly and easily navigate to MVC controllers and actions from IntelliTrace performance events useful. For feedback on this, or any IntelliTrace feature, please ask us at our diagnostics MSDN forum.

0 comments