If you have used cloud-based load testing before, you may already be familiar with the ability to run a ‘quick load test’ using the VSTS portal. It’s a great way to:
- Run a quick load test for your app – you just need to enter the app URL.
- Easily learn about the basic features – running tests from different locations around the world, viewing and analyzing results in the browser, analyzing the test errors, etc.
On the other end of the spectrum is using Visual Studio Enterprise to create and run load tests – while you can certainly create a simple load test using Visual Studio Enterprise, the full glory of the capabilities shine through when you write tests that mimic several end to end user scenarios, specify a test mix distribution, data-drive your test and even use rich extensible framework to create plugins necessary to suit complex testing needs.
What we have heard from customers is that often they want to write load tests that can do more than what the quick load test offers (for e.g., enter multiple URLs, send requests other than just a simple GET, simulate a complete user scenario), but the scenario is simple enough that it doesn’t require all the capabilities of Visual Studio Enterprise. With that feedback in mind, we have added the ability to create and run tests right from the browser, without needing additional tools. This blog post will help you get started.
If you develop or test web-apps, you may already be familiar with using the F12 developer tools of your browser. The developer tools allow you to do a wide variety of things: from inspecting HTML/ CSS/JavaScript, to viewing the traffic between the browser and the server.
Let us see how you can use this ability of viewing traffic between the browser and the server to create a load test for your user scenario. I am using Chrome as an example below, you can use any browser of your choice (Edge, IE, Firefox, etc.). This video shows how to create an HTTP archive with different browsers and Fiddler.
Creating an HTTP archive (.har) file using the browser
- Launch the browser and the developer tools (shortcut key – F12).
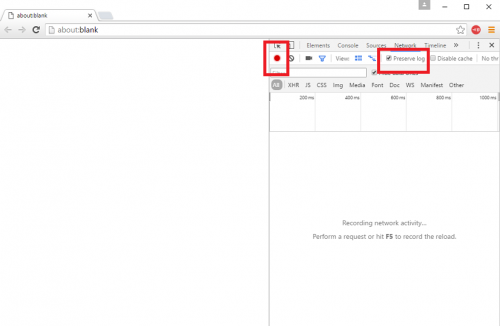
- Do a quick check to ensure your traffic is being recorded. For e.g., if you are using Chrome:
- Recording button is on (the round button is red)
- Check the “Preserve log” checkbox to ensure that the complete sequence of URLs for your scenario are captured. If this box is unchecked, the network activity recording is discarded whenever you reload the current page or load a different page, which means that an end to end user scenario may not be captured.

- Exercise your user scenario – enter the URL in the address bar and go through the sequence of actions a typical user would go through. For e.g., a user that comes to a retail store’s site to browse a product will go to the website, enter a product name in the search box, click on a link of interest in the search results, view the product information and so on and so forth.
- As you go through these actions, you will notice that all the traffic between the browser and the server is shown in the Network tab of the developer tools.
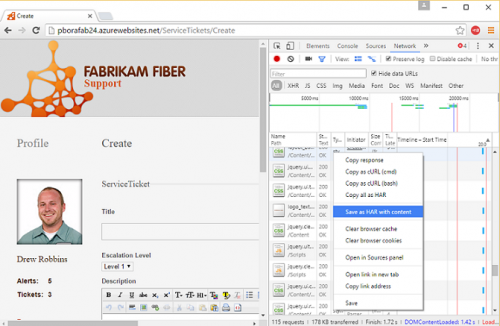
- Once you are done recording the user scenario, you can save the URLs as HTTP archive (.har). In Chrome, you can do this by right clicking in the URL list area and choosing “Save as HAR with content” in the context menu. Provide a name to your HTTP archive file and save on your computer.
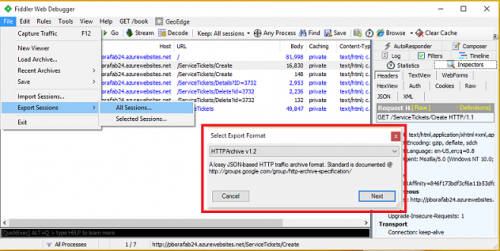
You can also create an HTTP archive using tools other than the browser. For e.g., Fiddler is a popular tool used for viewing and troubleshooting traffic. Use Fiddler to record traffic the way you usually do and Export sessions as HTTP archive.
Creating a load test using HTTP archive
- Login to the VSTS portal and browse to your team project.
- Under the Test hub, open the Load test hub.
- If you have never run any load tests using your VSTS account, you will be greeted with a getting started page that shows various options to create a load test.
- Click on +New->HTTP archive based test
- In the import dialog, provide the HTTP archive file that you recorded in the earlier steps and click OK.
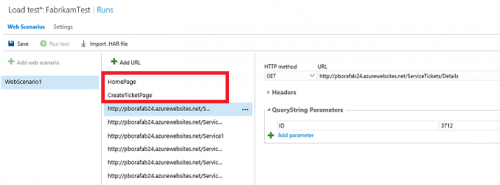
- The HTTP archive file gets read, the URLs are extracted and all the details – the HTTP method, Headers, Query String Parameters, Form Post parameters, etc. are displayed. You can provide a friendly name to your request URL in the center URLs pane, to easily identify requests.

- Some dynamic information such as ASP.NET view state, event validation, etc. – that varies from session to session and must be retained in order for a sequence of requests to succeed, are automatically identified and extracted from a request and co-related in subsequent requests that may use them.
- Use the Settings tab to view and change any load settings.
- Provide a name to your test and click save.
- You can now run your test by clicking on “Run test”.
- As the load test runs, you get to see a rich set of metrics that indicate how your app is performing under load. For more information on results and reports, see this blog post.
Wasn’t that easy? Go ahead and try it out. For any queries or feedback, reach us at vsoloadtest@microsoft.com
The feature is in preview and during this time, it is available for all users (except Stakeholders). You can leverage the free 20,000 VUM monthly quota to try this feature out. If you want to use load test beyond this, you can setup billing for your VSTS account, by following the steps here.
FAQ
- I want to simulate actions from different users and data-drive my test. Is that possible?
>> Currently, data-driving is not supported. It’s on our product backlog.
- Do you automatically identify and correlate all dynamic information from all requests?
>> No, automatic identification and correlation of dynamic information is currently supported for the ASP.NET information such as VIEWSTATE, EVENTVALIDATION, etc. If your request contains other dynamic information, they may fail. For such cases, our recommendation is to complete the tests using Visual Studio. See this blog for more information.
- Can I test REST APIs using the functionality offered in the portal?
>> To test REST APIs, you can use the URL-based test. Enter the request URL of your API and it’s necessary details to create your test.


Hey Prachi! We are really excited to try the load test function but we are using an IP whitelist on our dev and test sites (hosted in Azure). How can we find out the IP range of the agents that are running the load test so we can allow them into the site?
Hi Simon, There isn't a fixed list of IPs for the load testing service. If you want to use IP whitelisting, you will need to use the IP range for the datacenter from where you are generating load (doc). Have you looked at the other means available to test apps behind the firewall? (docs).
Please note that the load testing service is deprecated and discontinued on March 31st 2020 (link).