This final release of Team Foundation Server 2013 Update 2 and release candidate of Visual Studio 2013 Update 2 has over 100 new features and over 30 in JUST in the ALM space alone!
As many already know the developer division is now continually adding features to Visual Studio and these quarterly updates are our chance to both fix issues you have reported as well as release new value into the product.
For more information please see:
- Soma’s post at: http://blogs.msdn.com/b/somasegar/archive/2014/03/26/visual-studio-2013-update-2-rc-universal-projects-for-windows-and-windows-phone.aspx
- Brian’s post at: http://blogs.msdn.com/b/bharry/archive/2014/04/02/tfs-2013-2-update-2-released.aspx
- and of course the Visual Studio Online blog at: http://www.visualstudio.com/en-us/news/news-overview-vs
Final Team Foundation Server 2013 release:
Release candidates:
- VS 2013 Update 2 RC Patch
- VS Ultimate 2013 Update 2 RC Full install
- VS Premium 2013 Update 2 RC Full install
- VS Pro 2013 Update 2 RC Full install
- VS Express for Windows 2013 Update 2 RC Full install
- Release Management 2013 Update 2 RC
- Agents 2013 Update 2 RC
- VS 2013 Remote Tools Update 2 RC
In this post I will highlight the Test and Monitoring tools supplied by Application Insights.
Testing Tools
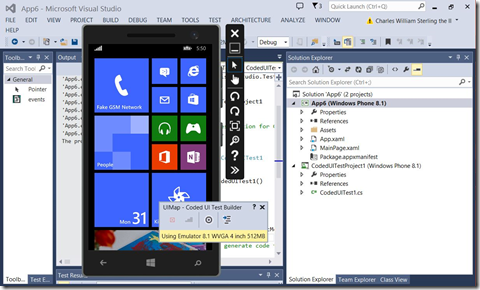
- Coded UI Testing for Windows Phone Applications
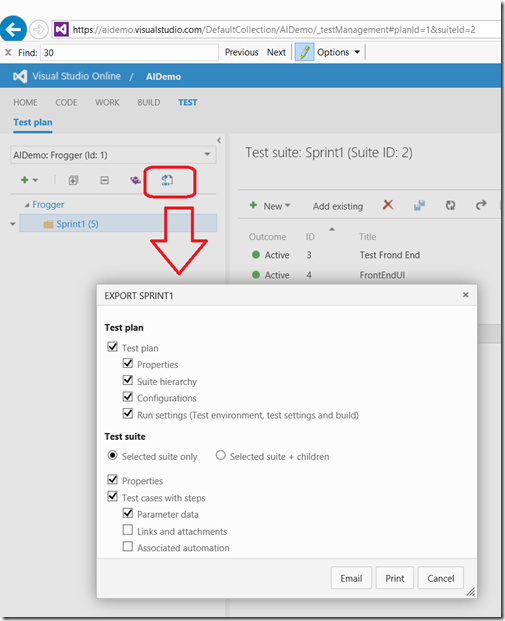
- Export test artifacts
- Manage test parameter data
- Grid view for Bulk Update Test Cases.
- Cloud Load Testing integration with Application Insights.
Application Insights
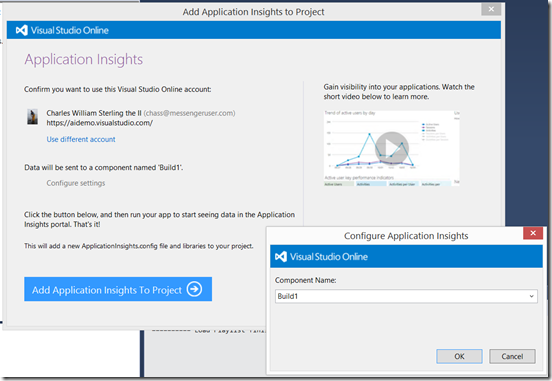
- Visual Studio Tools for Application Insights
- Auto configuration of monitoring with Microsoft Monitoring Agent and configuration files
- Integration of Application Insights with Cloud Load Test
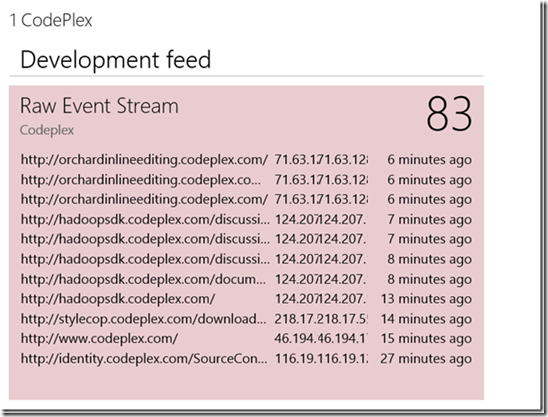
- The Streaming Data page and Raw Event Stream for Dashboards
- Logging Integration with Search in Application Insights
- City level reports from Usage
Testing Tools
Coded UI Testing for Windows Phone Applications
You can now create both automated unit tests AND functional end-to-end scenario tests using coded UI tests for your XAML-based Windows Phone 8.1 applications with With Visual Studio 2013 Update 2. This all Integrated into your ALM process using Test Explorer. See httphttps://aka.ms/WPTest

Export Test artifacts from Team Foundation Server Web Access
This update provides to testers and test leads the ability to export test artifacts so that these can be sent by using email or as printouts and shared with stakeholders who do not have access to TFS.

Manage shared test parameter data from Team Foundation Server Web Access
You can now run run a test case multiple times, each time with different sets of test data from Team Foundation Server Web access by adding parameter names to test steps and specifying parameter values in the test case. As an added boon these share parameters are reflected in all referenced test cases automatically. To get started, convert your existing local parameters in test cases to shared parameters or create new ones by navigating to the Parameters tab in Test hub.

Grid view for Bulk Update Test Cases from Team Foundation Server Web Access.
While we actually put this into the last update I don’t think I mentioned it in the last blog post! We now enable one of the top user requests -the ability to do bulk update in the Web Access of Team Foundation Server. Another nice feature of this new view is it automatically formats the data for the clipboard allowing great interaction with Excel.

**Cloud Load Testing is now integrated with Application Insights. **
One of my favorite features is the ability to automatically associate your cloud based load Tests with Application Insights. This integration gives you insight and diagnostics directly from a load test. Please see the Channel9 video for a complete walk through on getting this setup: https://channel9.msdn.com/Series/Application-Insights-for-Visual-Studio-Online/Getting-Started-with-cloud-based-load-testing-and-Application-Insights

Application Insights
**Visual Studio Tools for Application Insights **
Adding monitoring to your application couldn’t be easier! Now with Visual Studio Tools for Application Insights you can easily add Performance monitoring and Usage Monitoring with direct links to Performance monitoring, Usage Monitoring, Availability monitoring, Visual Studio Online Portal and your Application Insights dashboards directly from your Windows Store or Web Applications from both existing application or a new application. See: https://aka.ms/aivsix to download or more information and this walk through video https://channel9.msdn.com/Series/Application-Insights-for-Visual-Studio-Online/Getting-started-with-Application-Insights-Tools-for-Visual-Studio

**Auto monitoring configuration with Microsoft Monitoring Agent (MMA) and ApplicationInsights.Config files **
The ability of Microsoft Monitoring Agent to auto enable monitoring based from a configuration file is a huge boon for deploying your application. All you need is the the latest Microsoft Monitoring Agent and a configuration at the root of your web site. The next time IIS restarts MMA will walk through all your Web application running under IIS looking for this file and automatically start monitoring if one is found. Also very convenient if you want to start monitoring to a different server or application. As a result of automatically enabling monitoring, the Microsoft Monitoring Agent setup no longer prompts for an Account ID or Instrumentation key. -But don’t worry if you want to go old school and set up a default or configure your monitoring via PowerShell you still can! For more information please see https://channel9.msdn.com/Series/Application-Insights-for-Visual-Studio-Online/Getting-Started-with-Application-Insights-from-Visual-Studio-Online

**Integration with Cloud based Load Test **
Like I mentioned above with the integration of the Application Insights and Cloud based Load Testing is it much easier to see what is happening inside your application and trouble shoot any issues discovered. Please see the Channel9 video for a complete walk through on getting this setup: https://channel9.msdn.com/Series/Application-Insights-for-Visual-Studio-Online/Getting-Started-with-cloud-based-load-testing-and-Application-Insights

**The Streaming Data page and Raw Event Stream for Dashboards **
One of the most frustrating things in setting up custom usage monitoring was waiting for the data to curate and become visible in the Usage reports to see if I set it up correctly. Now Application Insights now offers a real time view of your usage data! Please see the Channel9 video for a complete walk through on getting this setup: https://channel9.msdn.com/Series/Application-Insights-for-Visual-Studio-Online/Getting-Started-with-Application-Insights-from-Visual-Studio-Online

Logging Integration with Search
With the goal of solving all your application monitoring needs Application Insights is one step closer by now enabling the integration of your application logging data with the rest of the Application Insights monitoring data. Please see the Channel9 video for a complete walk through on getting this setup: https://channel9.msdn.com/Series/Application-Insights-for-Visual-Studio-Online/Getting-started-with-Log-Search-in-Application-Insights
City level reports from Usage
In addition to dramatically speeding up the global usage reports we have added the ability to drill down to the city level. One caveat is in order to make this happen we needed to change the storage schema and had to truncate the global information for all usage data before March 2nd

For the rest of the ALM features (listed below) please check the readme:
http://support.microsoft.com/kb/2927432/en-us
Team Foundation Server
- The portfolio backlogs have performance improvements during web access navigation.
- You can query on tags in Visual Studio and through web access.
- You can apply tags to work items in Visual Studio.
- You can apply permissions for who can add new tags.
- REST API is available for work item tracking tagging.
- You can edit tags in the Excel add-in for Team Foundation Server.
- You can configure non-working days, and these are excluded from burndown charts.
- Cumulative Flow Diagram start dates are configurable.
- Lightweight charts can be pinned to project or team homepages.
- You can customize the colors in lightweight charts.
- The look and feel of the project and team homepage is updated.
- Assume that you use Git hosted on TFS as source control system, you can access the deployed version of the solution by opening the iTrace file that is generated by the Microsoft Monitoring Agent, in Visual Studio Ultimate 2013.
- Git tools have been updated to include an annotate view, reverting a commit, amending a commit, pushing to multiple remotes, and improved progress and cancellation ability for long running operations.
Release Management
- The tags are designed to perform the same operation across the servers. If there are server specific actions, the user can always add the specific server and the corresponding actions at that level in the deployment sequence.
- To configure a group of server by using same tag implies that you can set values for the whole group and all the servers in the group therefore share common values for all variables.
- You can easily deploy to identical or clustered servers without having to repeat the deployment sequence on each server.
- You can **Copy Tags **across stages and across Templates. You can retain the same deployment sequence with all the tags and servers when copied to other stages or Release templates under the same environment.
Debugger
- Added a Visualizer for JSON data contained in String objects.
- You can inspect instance values when you debug managed memory issues from dump files.
- You can compare two .diagsession files that contain managed memory data with each other.
- You can manually trigger Content prefetch in Windows Store applications.
- Enabled Script debugging including the DOM Explorer and JavaScript console when debugging inside a WebView control.
- Added extensibility point for Visual Studio plugins to modify the debugger’s symbol settings.
- The values of individual objects can be inspected when you debug managed memory from a dump with heap.
Profiler
- New CPU Usage tool for examining which managed, native, and JavaScript functions are using the CPU. The CPU Usage tool replaces the previous CPU Sampling tool for Windows Store Apps and has fast time filtering, fast thread filtering, and an improved Just My Code experience.
- New Memory Usage Tool supporting Windows Store and Windows Phone Store apps using C#/VB/C++ and XAML
- The diagnostics hub now allows more than one tool to be run at the same time. Data from each tool is correlated on a common timeline for faster and easier performance analysis. Tools that can be combined are:
- You can visually debug or inspect a **WebView **control in your websites and Windows Store applications. The Script Debugger, DOM Explorer and JavaScript Console can be used to debug HTML and JavaScript that is running inside a **WebView **control hosted in Windows Store Applications of all types (HTML, JavaScript, Managed and Native).
IntelliTrace
- Performance events that are SQL related now provide an option to load the SQL in a new query window and use the existing SQL tools inside of Visual Studio to investigate an issue.
- Performance events that are MVC related now provide an option to go to either the action or controller method in code to investigate an issue.
- Performance events can now be grouped by entry point and by the slowest node. This will reduce the overall number of rows and make it easier to identify a specific event to investigate.
- When you check the details of an IntelliTrace performance event, there is now an indicator to highlight the path to each of the slowest nodes.
- When you debug an exception event from an IntelliTrace log file, Code Map is now shown with IntelliTrace specific annotations so that interesting parameters can be easily displayed. This also shows where the exception was thrown by using a new comment on the graph.
Code Generation
- This update enables developers specify his program be compiled to target latest-generation processors that support the AVX2 instruction set.

0 comments