Memory Usage tool in the Diagnostics Tool window
In Visual Studio 2015 CTP 6 we introduced the new debugger-integrated diagnostics tools, including the Memory Usage tool. For the first time, you could investigate memory growth on the managed heap without leaving everyone’s favorite tool, the debugger. Based on your feedback, we’ve been refining the experience for Visual Studio 2015 RC. In this blog post, I’ll demonstrate how to use the Memory Usage tool while debugging to find and fix a common source of leaks in .NET code: event handlers. Along the way, I’ll introduce the updated UI.
The sample app
For this walkthrough, I’ll be using the WPF version our sample app, PhotoFilter. You can find it in the PhotoFilter.WPF folder inside the solution (zip file).
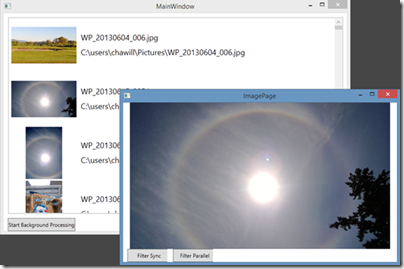
PhotoFilter loads all the images in your Pictures library, and displays them in a list. Double-click any image to open an ImagePage view in a new window. While the MainWindow list displays smaller thumbnails, the ImagePage view shows a scaled version of the full image. PhotoFilter offers two ways to view this larger image: either change the selection in MainWindow to update the image displayed in the open ImagePage window, or close the ImagePage window and open a new one by double-clicking again in the Main Window’s list.
What’s a leak anyway?
There are only a handful of ways to leak memory in the managed, garbage-collected environment of the .NET CLR. One of the more common scenarios is when the garbage collector refuses to clean-up an object, even though we are certain it’s beyond its useful life. This is generally an indication that some object somewhere is holding a reference to the should-be-dead object. Sometimes these references are very subtle, or not apparent in our own code. Using the Memory Usage tool, we can not only discover the leaks, but also track down the references that are keeping the zombies alive.
Discovering the leak
I start debugging to run the application, exercising the code paths while watching the Memory graph. The graph displays process memory using a metric called Private Bytes. You can find more on Private Bytes in one of my earlier blog posts on the Memory Usage tool. An app’s managed heap is part of the process memory, so increases in the heap will also cause increases in the Private Bytes.

Repeatedly opening and closing new ImagePage windows shows a disturbing trend on the graph. Each time I open the ImagePage window, the memory climbs. The first jump, at point A, I expect to happen. Each time my application opens the ImagePage, the bitmap being displayed is fully decoded into memory. Point B is where I get concerned. At that point, I closed the ImagePage window, and opened and closed three new ones for the next pictures in the list. After closing the first ImagePage, I expect the next garbage collection to clean up the ImagePage and all the memory it used. Instead, what I see is a stepped pattern of memory always showing a net increase. Each new ImagePage adds to the overall process memory. Closing them doesn’t result in the memory being cleaned up. These are signs of a leak.
Finding the source
I only exercised the code paths for these two views. So, I can be pretty sure that this leak behavior is somehow related to the ImagePage objects. One option, something we’re all pretty familiar with, is digging around the code seeing if anything looks “suspicious” or “smells”. With VS2015, instead of hunting and smelling, we can use the Memory Usage tool.
I’ll do that by taking snapshots before and after the interesting parts, and then investigating the diff to better understand what’s keeping the zombie objects alive.
The Memory Usage tab
In the Diagnostic Tools window, I’ll switch to the Memory Usage tab. Once there, a simple toolbar shows me all the basic interactions.

*Note: “Take Snapshot” temporarily pauses the process if it’s running, and walks the managed heap. This finds all the objects that are still live and not eligible for clean up by the garbage collector. Once a snapshot completes, an overview of its key stats appears in the table below the toolbar. *
Getting back to my investigation, I start debugging. Then I wait for the app to start and for the memory graph to stabilize. For many applications, you’ll want to interact with it first to ensure you’ve eliminated any initialization costs before considering the memory usage stabilized. This app is very simple, so I won’t worry about additional initialization costs for my current investigation.

Once the graph has settled, I take the first snapshot, which will serve as the baseline for comparison. Because I first noticed the issue by opening and closing the ImagePage view a few times, for my investigation I’ll follow the same steps. This time, however, I’ll open and close it a total of ten times. This should help amplify any “spikes” in the data.
Before taking the second snapshot, I first want to get my app into a break state. Unlike snapshots taken while the app is running, snapshots taken while broken have a super-power: you can inspect the values of the individual instances of objects live on the heap. This super-power is only available while you’re still in the same break state that the snapshot was taken in. Once you continue, or take another step, instance inspection won’t be available on that snapshot again.
But, how do I know where to set my breakpoint? No need! Once I’ve completed my repro steps, I can just press the Break All button on the Debug toolbar.

Now that we’re in a break state, I’ll go ahead and take the second snapshot. Once it’s finished, I’ll keep the process paused. Notice the gray arrow to the left of the second snapshot in the table below? That indicates that the object inspection super-power is available for that snapshot as long as I don’t continue, step, or stop debugging.

Snapshot overview table
Let’s take a look at what each snapshot shows us in the overview. From left-to-right:
- The snapshot’s sequential number. Numbers are reset each debugging session.
- The process running time when the snapshot was taken.
- The count of the live objects on the managed heap. In parenthesis is the diff of the count from the preceding snapshot.
- The size of the live objects on the managed heap, also followed by a diff in parenthesis.
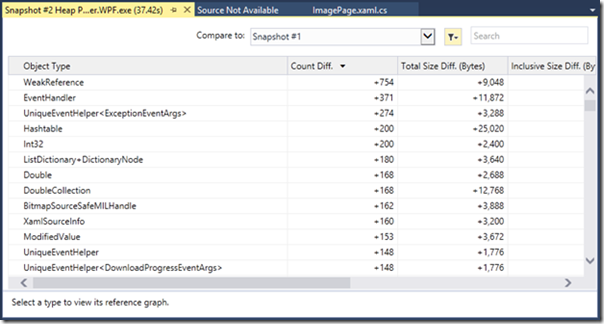
Each blue metric in the table is a link that launches the Heap View for the snapshot. Heap View will be the focus of most of your memory investigations. I’ll start with the live object count diff. By clicking the object count diff link (gold arrow in above image), Heap View opens in diff mode, sorted by the “Count Diff” column. By default, the diff mode compares the chosen snapshot to the one immediately preceding it. If you have more than two snapshots, you can use the “Compare to” dropdown to customize which snapshot to compare against.

There’s quite a bit of data in the Heap View. Depending on your knowledge of the .NET framework, the types at the top of the table may look completely unfamiliar. Don’t let that discourage you! A very simple strategy let’s you start with the types you know best: the types you wrote in just your code. I’ll show you how.
In the top-right corner of the Heap View, there’s a search box. I can quickly narrow down the types in the table by searching for my app’s module name ‘PhotoFilter’.

And there it is, right at the top of the Types table: PhotoFilter.WPF.ImagePage. A total of 10 instances are still alive, despite the fact that the windows hosting the views are long closed. Now, I’ve confirmed the leak, and know one of the players. Unfortunately, I still don’t know why these ImagePage objects are zombies.
Instances, instances
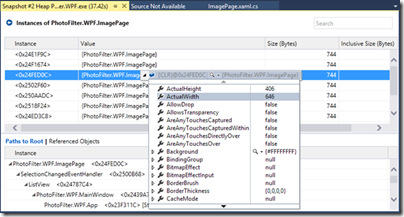
When hovering over the entry for PhotoFilter.WPF.ImagePage in the table, you’ll see an icon appear. This is the Instances view icon. I click it, and navigate to a new view that shows data on the individual instances of ImagePage.

Because this snapshot is super-power enabled, I can inspect each instance, with full DataTip support for complex values.

Inspecting each ImagePage, I confirm that these are the views of the images I clicked on. These should have been cleaned up by the garbage collector, but some object somewhere is holding a reference to each instance. By selecting an instance in the top pane, the Paths to Root will open in the bottom pane. This view shows a bottom-up hierarchy of what objects are holding references that prevent garbage collection. Here, in the Instances view, the tree will auto-expand to show the primary roots. Following these paths usually reveals the culprit. For ImagePage, it’s also worth noting that each instance has the exact same type hierarchy in its Paths to Root. So, for my investigation, a single code fix might be all I need.

Right below PhotoFilter.WPF.ImagePage is a suspicious entry: SelectionChangedEventHandler. Event handler subscription is a well-known cause of leaking objects in .NET. Continuing up the tree, I can see that the event handler belongs to a ListView. My app only has one ListView, on the MainWindow. I know the major players are the ImagePage, a SelectionChangedEventhandler, and the ListView that owns it. At this point, it’s a good idea to take a look at the code. I’ll begin with my own code, the ImagePage code-behind.
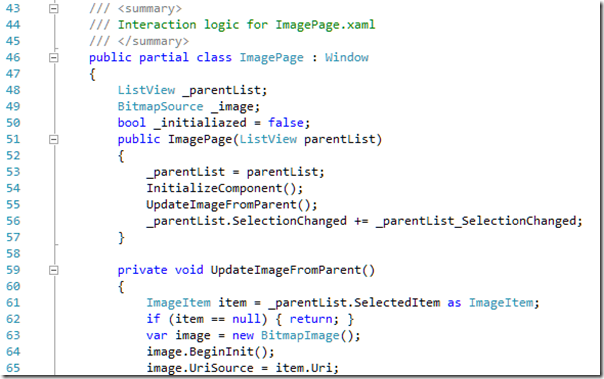
Right away, in the ImagePage constructor, I see all the major players come together.

A reference to a ListView is passed to the ImagePage constructor (line 51), and the new instance of ImagePage subscribes to the SelectionChanged event of that ListView (line 56). Looking at the subscribed event handler, _parentList_SelectionChanged, this code implements the feature that updates an open ImagePage view when the selection changes in the ListView on the MainWindow.
An object that subscribes to an event of a longer-lived object needs to explicitly unsubscribe from that event at some point, or else the shorter-lived object will never really die. For PhotoFilter, I decided to override the Window.OnClosed handler, and unsubscribe from the SelectionChangedEventHandler there (line 73).

Now, when I close an ImagePage window, it unsubscribes itself from the ListView.SelectionChanged event. If that event handler was the only reference rooting the object, they should now be cleaned up by the garbage collector.

It’s always a good to verify a fix, so I’ll rerun the experiment to make sure memory is getting cleaned up by the garbage collector as expected. Looking at the graph, after restarting the app and opening and closing ImagePage 10 times, this now appears to be exactly what’s happening. Before the fix, process memory was around 350MB. After the fix, it’s now less than 100MB. Problem solved!
Get Visual Studio 2015 RC
Download Visual Studio 2015 RC. Alternatively, save some time and use the provided VM of Visual Studio 2015 RC in Azure.
Let us know what you think
Please submit suggestions on UserVoice and bugs or quick thoughts via Send-a-Smile in the Visual Studio IDE. You can also share your comments, below.


0 comments