In your normal edit->compile->debug workflow, you will generally use the Debug build configuration. Debug builds compile code to keep the executable machine code as close to the original source as possible to ensure an optimal debugging experience. This however can come at the expense of performance, both memory and speed. Conversely, when you change to a Release build the compiler will make choices to create executable machine code that is as efficient as possible without any consideration for debugging. Examples of compiler optimizations include (but are not limited to):
- Dead code elimination
- Dead variable elimination
- Redundant code elimination
- Loop optimizations
- Register allocation of variables
- Inline expansion of code
The net effect of these optimizations is that debugging your application using the original source code will feel very unreliable. The most common behaviors that you will see when trying to debug optimized code are:
- Inability to inspect variable values: this results from the debugger being unable to determine where a variable value is stored. Depending on the language there may be switches you can use to help the debugger read variable values (e.g. for the Visual C++ compiler, the /Zo flag includes some variable location information in the PDB file), but it will still be significantly more limited than a Debug build. Additionally not all languages and run times have support for this including .NET where the Just in Time (JIT) compiler does not generate any information to help a debugger due to performance reasons.
- **Inability to hit breakpoints: **Typically caused by inline expansion of code resulting in the location you are setting the breakpoint not actually existing in the executable code. Other optimizations including instruction scheduling, various loop optimizations, redundant code elimination, and vectorization will also result in the executable code looking very different than the original source so will also impact breakpoints.
- **Unpredictable stepping behavior: **Stepping behavior will be unpredictable for the same reasons called out above for breakpoints. Compiler optimizations will change the structure of the code executing so steps will appear to skip lines and jump to odd locations.****
What can you do?
The easiest way to avoid the complications that come with debugging optimized code is to compile your application using a Debug build whenever possible. However, this is not always possible so there are a few other things that you can do if you must debug a Release build.
C++ (and other statically compiled languages)
For statically compiled languages like C++, determine if the compiler has any options for recording optimization information and/or selectively de-optimizing certain portions of the code. For example, with the Microsoft Visual C++ compiler the /Zo flag will record variable optimization information that the Visual Studio Debugger can use to obtain the values for inspection in some cases. Additionally, if you are debugging optimized builds because you need application to run at speeds only provided by the optimized build, you can selectively tell the compiler not to optimize individual functions using #pragma optimize(“”,off)
.NET (and other JIT compiled languages)
.NET applies optimizations in two phases. First, when the source code is compiled to the Intermediate Language (IL) that is stored in the binary. Second, the JIT compiler applies optimizations when it compiles the IL to machine code. The Visual Studio debugger includes an option that will tell the JIT compiler to not apply optimizations to any modules that are loaded after the debugger is attached (so if you are launching the process it will not apply any optimizations to any binaries). In Visual Studio 2015 this option is off by default but if you must debug an application compiled Release, you can turn it back on under Debug -> Options and check “Suppress JIT optimizations on module load (Managed only)”.
In versions of Visual Studio prior to 2015 this option was enabled by default. We however chose to change the default in Visual Studio 2015 to disable the option for several reasons:
- While it will prevent the JIT compiler from applying optimizations it does not prevent the source to IL compiler from applying optimizations. Meaning you will still have a degraded debugging experience.
- Debugging code in this state is not representative of any state your code will actually run in production.
- The performance of all loaded modules is affected. Meaning if you are using a large number of third party libraries the application run may significantly slower when debugging. For example, if you are debugging a Visual Studio plugin all of Visual Studio’s .NET binaries will run slower even though you are only concerned about debugging your plugin.
Use the Disassembly window to compliment your source code
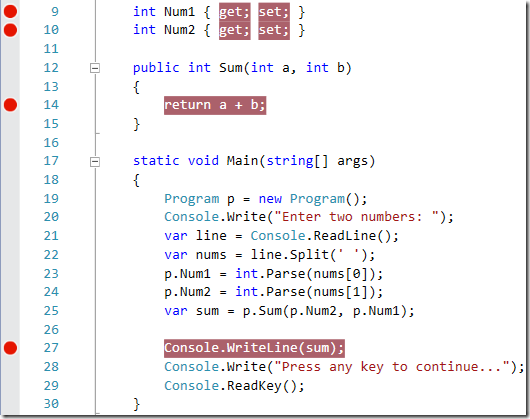
As I covered above, compilers change the structure and layout of your code while applying optimizations. For example, take the C# console application below. When I start debugging, none of my breakpoints are hit in the Release build!

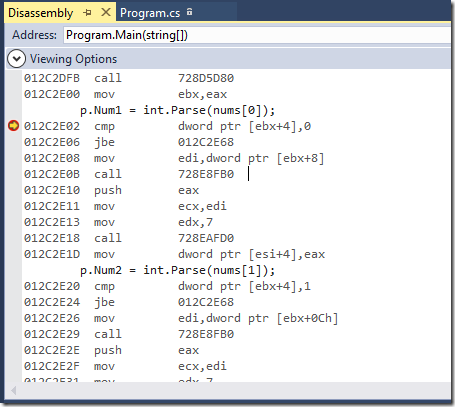
To successfully debug this, I set a breakpoint on line 19 (the first line in the method) which does hit. Once I am in a break state I right click in the editor and choose “Go To Disassembly” to open the Disassembly window overlaid with the corresponding source code. In this window, I can step through the actual instructions executing and even use breakpoints as I would in the standard source code editor.

While the disassembly is a lot more verbose and a little harder to understand, this is an accurate representation of what is executing so you won’t encounter issues with erratic stepping and breakpoint behavior.
Conclusion
Debugging optimized code can be tricky and hard to do, so when possible you should try to use Debug builds. If you must debug optimized builds, I covered a few tricks to try in this blog post to improve your experience. As we continue to evolve the compilers and debugger in Visual Studio, we’d love to hear from you how often you need to debug optimized code, what scenarios you need to do this in, and how important it is to you for us to continue to improve capability. Let me know below in the comments section, through Visual Studio’s Send a Smile tool, or via Twitter.

0 comments