Note: a more recent documentation is available from Analyzing with SonarQube Extension for VSTS/TFS
[Update Sept 11, 2015: fixing broken links, Thanks Terje!, and adding a Previous post / Next postsection at the end of the post]
_
As you may be aware, we have been working with SonarSource to integrate SonarQube with MSBuild, Team Foundation Server, and Visual Studio Online. Up to now, you could use the MSBuild.SonarQube.Runner to perform analysis locally on your development box, or in TFS (2013 or 2015) and VSO, but you had to provide your own build agent, install Java, and setup the MSBuild.SonarQube Runner on that agent.
Today we released in Visual Studio Online two new build tasks to execute a SonarQube analysis:
· SonarQube for MSBuild – Begin Analysis
· SonarQube for MSBuild – End Analysis
These tasks can be added as steps in a build definition in exactly the same way as any other tasks.
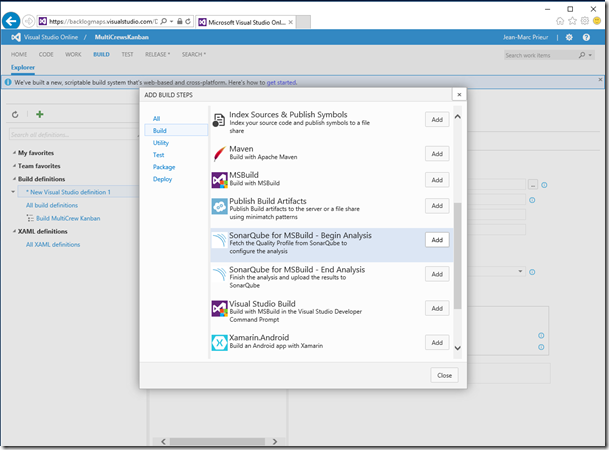
As the name suggests, the first of these tasks is used to define a step that start the SonarQube analysis, before any MSBuild build steps. The Begin Analysis task contacts the SonarQube server to retrieve the quality profile, and dynamically produces rulesets to be applied during the static analysis. It also sets things up so that the following MSBuild steps produce some data to prepare the analysis.
The End Analysis task should be used to create a step that is executed after the “Visual Studio Test” task step if you want SonarQube to show code coverage data. In any case, it should be run after the “Visual Studio Build” step. The End Analysis task finalizes the analysis (computation of the clones, metrics, and analysis for languages other than .Net), and sends the analysis results to the SonarQube server.
Configuring the SonarQube build tasks
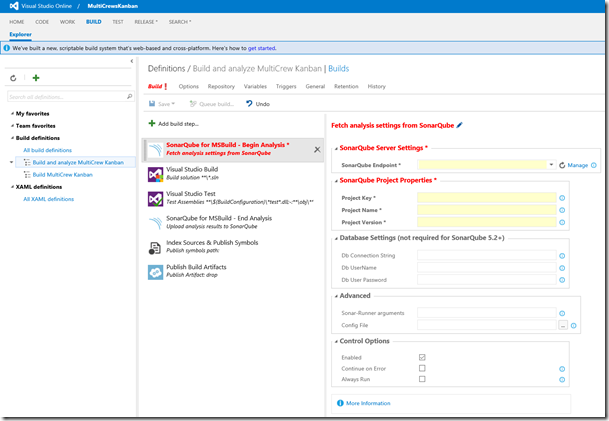
In the screenshot below, you can see that I’ve added the two SonarQube tasks as steps in my existing Visual Studio build definition. Note that the End Analysis step does not require any parameters.
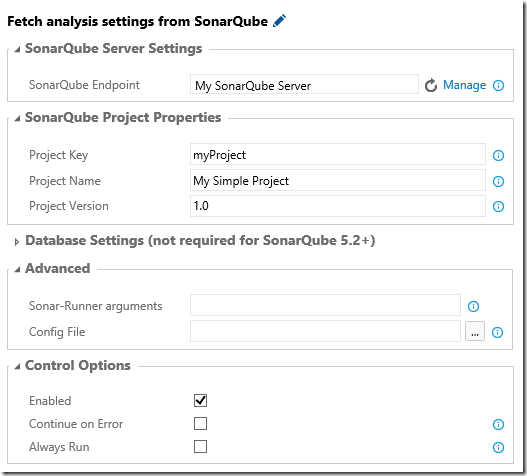
Now let’s have a look at the settings that I need to configure in the “Begin Analysis” step:
· SonarQube Project Properties
· The completed Begin Analysis definition
SonarQube Server Settings
Here you choose a service endpoint that you previously configured, which defines the URL and credentials required to contact your SonarQube server.

If you have not already configured your SonarQube service endpoint (if it does not appear in the endpoint combo-box):
· Choose the Manage link at the right-hand end of the VSO window header to open the Services tab of the Administration pages for your account.
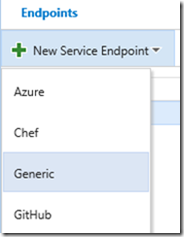
· Add a new Generic service endpoint:
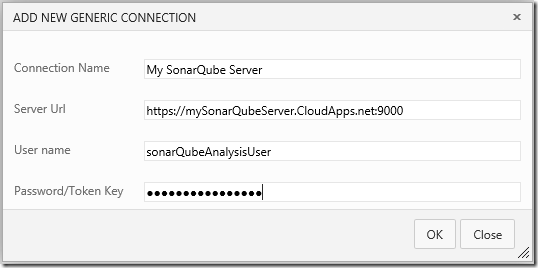
· Enter the values for your SonarQube server:
o A friendly name identifying your service endpoint, which will appear in the endpoint combo-box.
o The URL of your SonarQube server.
o The user name and password (or security token) for the user executing the analysis. You must enter values for these two fields. If your SonarQube server is on-premises, you can use anything (for example, “anonymous” and “anonymous”). Of course, here my SonarQube server is running in an Azure VM, so I must provide the appropriate credentials.
· Now go back to the build definition page and choose the “Refresh” icon so that the endpoint appears in the combo-box, and select it.
SonarQube Project Properties
The next group of settings are the SonarQube project key (which uniquely identifies your SonarQube project on the SonarQube server), the SonarQube project name, and the SonarQube analysis version. These are the same parameters as those you use in the XAML build configuration.

Database Settings
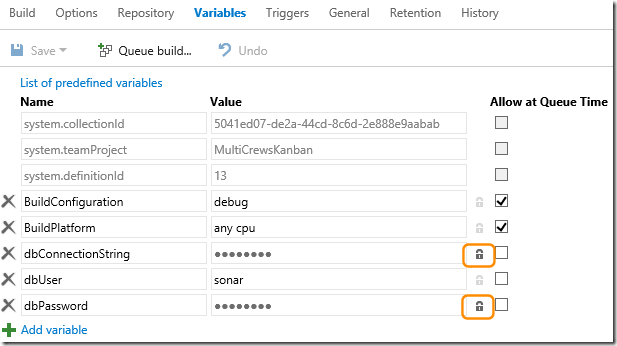
The third group of settings are the SonarQube database parameters. These are required only until SonarSource ships SonarQube 5.2 (starting with that release, SonarQube will have a 3-tier architecture, and you won’t need to provide the database details).

In the screenshot, because these parameters are secrets, you can see that I’ve chosen to add them using build variables. This hides the values themselves because I’ve defined the variables in the Variables tab of the build definition and chosen the “padlock” icon.
The completed Begin Analysis definition
Here is my complete build definition:
Choosing the agent
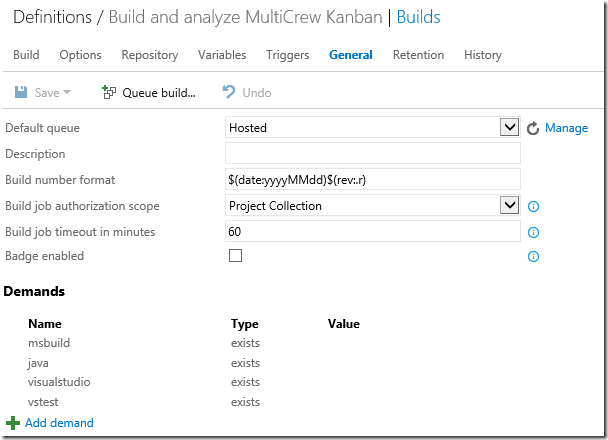
The cool thing is that, not only can you (as you’d expect) run the SonarQube build tasks with your own agent, you can also run them with the hosted agent. In fact, the build tasks embed all the necessary integration bits. The only constraint is that, if you want to use the hosted agent, you must ensure that your SonarQube server and (until SonarQube 5.2 ships) your database are accessible from the Internet. That is the case here because I’ve used an Azure Virtual Machine. However, if I had an on-premises SonarQube server, I could also – if my organization authorized it – open some TCP/IP ports to allow access from the Internet.
The following screenshot shows that I used the Hosted agent as the default queue.
Performing the analysis
Performing the analysis is now very simple. You queue the build, or you change the Triggers tab of your build definition to enable a build and analysis as part of your continuous integration – and that’s it!
More options
You might have noticed, when I described the configuration of the Begin Analysis task, that I didn’t mention the Advanced section. This section provides two opportunities to pass additional parameters to the SonarQube server:
· Add space-delimited command line arguments, which will be copied to the MSBuild.SonarQube.Runner command line. This allows you to pass extra properties, for example: /d:propertyName1=value1 /d:propertyName2=value2
· Add a configuration file, which will be chosen from the files in source control (in your Git repository or TFVC branch). This file has the same format as the SonarQube.Analysis.xml file that is dropped with the MSBuild.SonarQube.Runner 1.0. It’s a list of SonarQube properties and values.
A wealth of possibilities for analyzing your .NET projects
With the release of these two new SonarQube build tasks, you have a wealth of possibilities for analyzing your .NET applications. It really depends on whether you want to use TFS, VSO, or only MSBuild; and which build technology you prefer (XAML build or new build). To help you out, I’ve put together a summary of these possibilities. What I’ve described in this blog post are the last two rows of the table.
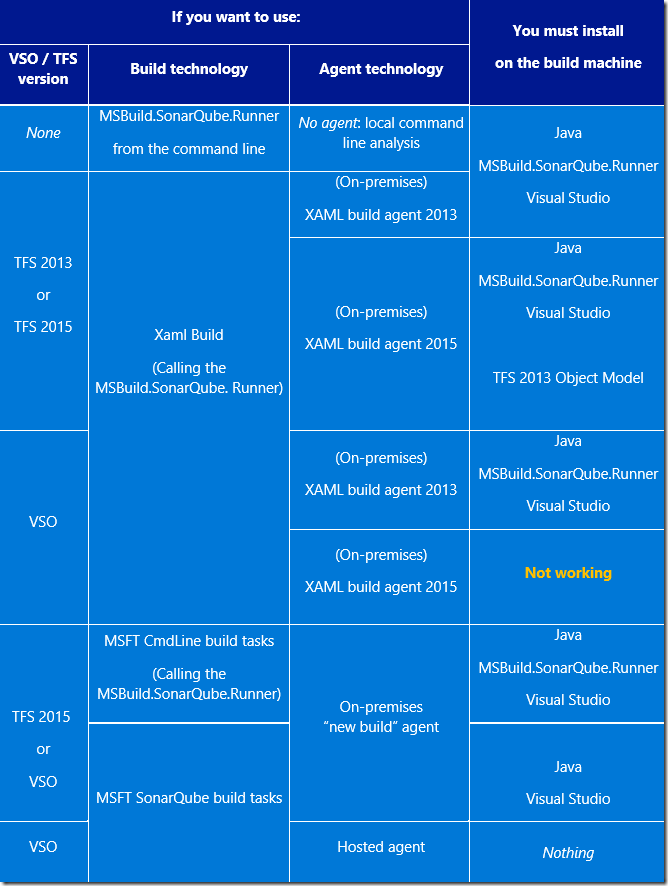
Note that SonarQube integration does not work with VSO in the case where if you want to do a XAML build with a XAML 2015 build agent (more details here). You need to use a XAML 2013 build agent instead.
If you analyze C# code, use SonarLint for Visual Studio to get alerted as you code in Visual Studio 2015, and fix some of the issues automatically.
If you analyze C# code, and with whatever option you chose in the above table , you can get, in the Visual Studio error list, the same static analysis issues as what the SonarQube C# plug-in generates. For this, SonarSource has been shipping a Visual Studio 2015 extension SonarLint for Visual Studio which contains Roslyn analyzers. And, by the way, they released a new version yesterday (SonarLint for VS 1.2.0). This new version now includes code fixers for 19 of the static analysis rules: by using the light bulb icon associated with the warnings generated by these rules, you can choose to fix them, instance of issue by instance of the issue, for a whole project, or in the whole solution, therefore actively reducing your technical debt.
In closing
In a future post, I’ll provide more details of the options and possibilities you now have to perform a SonarQube analysis, including some examples of usage. I’ll also show you how to use the additional options to run third-party plugins.
Meanwhile, as usual, we look forward to receiving your feedback.


0 comments