Visual Studio 2013 Update 3 CTP1 brings improvements to Code Map and Debugger Map that you have requested via various feedback channels (user voice and connect in particular). In this Blog post I’ll present:
- Improvements to the Debugger map zoom experience
- Link styling on Code Map
- Drag & Drop of binaries to a code map
Improvements with the Debugger map zoom experience
Debugger Map
In Visual Studio 2013, we introduced Debugger Map, which provides a nice experience to present the call stacks, and even the call graphs from breakpoints into the debugger. A debugger map can also show traces from an IntelliTrace file, either collected standalone, or from Application Insights. If you are not familiar with Debugger Map please look at Map methods on the call stack while debugging in Visual Studio
In Visual Studio 2013 Update 2, we improved the experience with IntelliTrace by providing parameters directly on nodes representing call stack entries (see Enhancements to Debugging Exceptions with IntelliTrace in Visual Studio 2013). In Visual Studio 2013 Update 3, we go a bit further by improving the zoom experience.
The improved zoom experience
Before this update, each time the user moved to a new call stack entry, for instance by stepping in the debugger through the code, using F10, or reaching a breakpoint after pressing “continue”, the debugger map would systematical show additional call stack entries (this is still the case), but unfortunately it would also “zoom to fit” in order to represent the full graph. This could rapidly get un-readable if there were a lot of methods involved in the call stack, because too many nodes and links would be represented, and therefore they would appear very tiny. To solve this problem:
- We have improved the experience by respecting the zoom level that you set (if you set one)
- Making sure the call stack entry of interest is always visible on the diagram (that would be the current call stack in an F5 debugging session, or the active call stack entry if you moved up the stack from the call stack window)
- Minimizing the panning of the map to bring the call stack entry of interest to view, therefore leaving you as much of the context as possible.
Link styling on Code map and dependency diagrams
Representation of dependencies before Visual Studio 2013 Update 3 CTP1
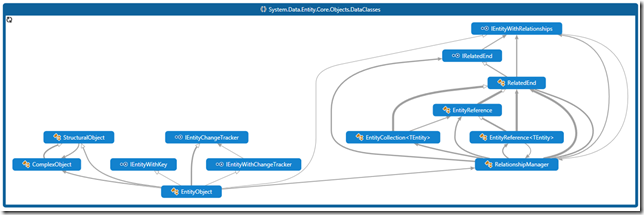
Until this update, you could add code elements on a code map, or request architecture dependency diagrams, and the nodes were colored and had icons, but the links were all grey. This did not help you understanding what they represented. Of course they represented dependencies but those are all kind of dependencies, such as inheritance between classes or interfaces, interface implementation between a class and an interface, calls between methods, field usage between a method and a field, etc … To actually see the categories that a link represent, you can hover the link, and look at the tooltip.
The following picture shows portion of a namespace from the Entity Framework open source project, as presented before Visual Studio 2013 Update 3 CTP1
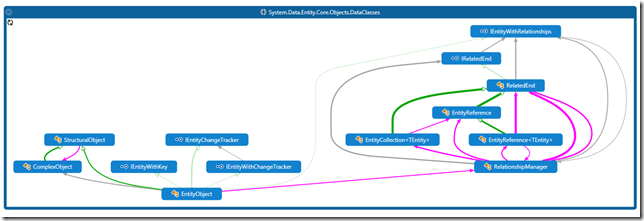
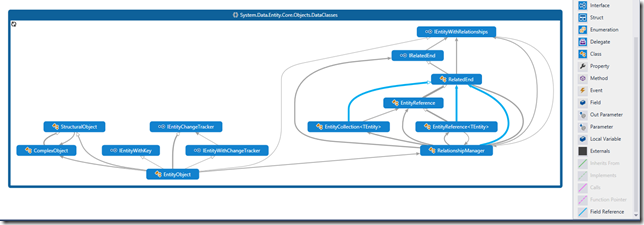
Here is the same picture after Visual Studio 2013 Update 3 CTP1. As you might see, this diagram is more understandable, provided I explain a bit what the colors represent.
Understanding the meaning of these links
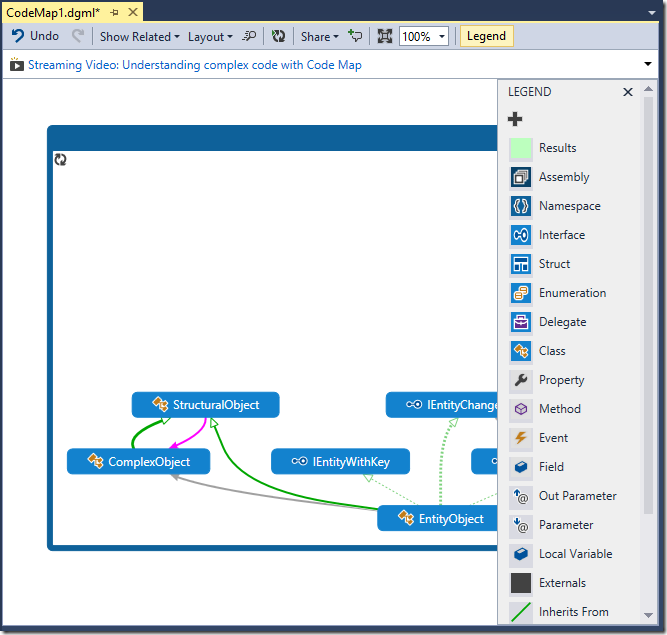
let’s have a look at the key for these colors, by clicking on the Legend button in the dependency diagram toolbox

The bottom of the legend show the following:
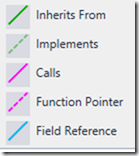
When there is a green link between EntityObject and StucturalObject, That does not mean that there are only inheritance, there are also method calls as well but these are hidden by the inheritance (There are method calls for sure because, in managed code if class D inherits from class B, then necessarily the constructor from class D calls the constructor from class B)
The green dashed links between EntityObject and IEntityChangeTracker means that EntityObject implements IEntityChangeTracker
The pink links between EntityObject and RelationshipManager means that EntityObject has methods which call methods in RelationshipManager, but there is no base/derived relationships between both. You may be wondering why we have chosen this pink color, this because it was close to the color of the method icon in the solution explorer or Class View, and also worked well in the light, blue and dark themes of Visual Studio.
The blue links represent references of fields by methods. This line is solid when the method writes the field, and dashed when the method only reads the field

All the other links remain gray. They correspond to method return types, or type references
What if I’m interested in seeing the field references, and don’t want to see the inheritance?
If you are not interested in seeing the inheritance and method calls, but want to understand when there are field references, you can always disable the styles corresponding to Inheritance, interface implementation, calls by right-clicking on the styles and choosing “Disable”
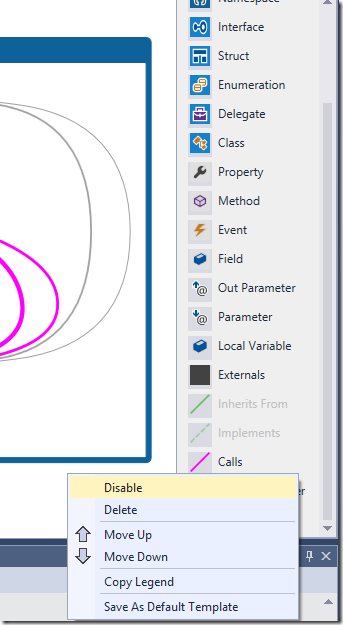
The disabled styles will appear grayed out, and you will only see the colors corresponding to the styles which are enabled.
Note that this is not yet filtering, but that helps already understanding the dependencies better
Colors are useful for high level Dependency diagrams as well
The following picture shows the top-level architecture of the product code for Entity Framework Tools before the Visual Studio 2013 Update 3 CTP (I’ve selected the product code assemblies, and requested the contextual command “Show on Code Map”)
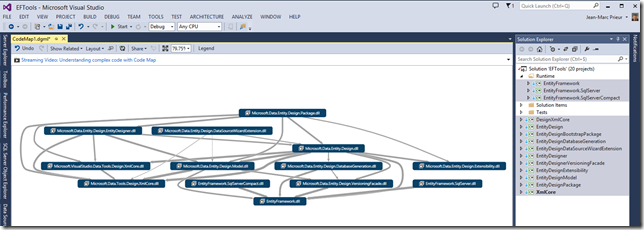
From Visual Studio 2013 Update 3 CTP1 we get the colors as well: they represent the summaries of the individual links inside the assemblies, still using the same legend, and priorities of display

You will probably have understood it already. When I see a green dependency between Microsoft.Data.Entiry.Design.VersionningFacade.dll and EntityFramework.dll, this means that at least one class of the first assembly inherits from one class in the second assembly (or at least one interface in the same assembly inherits from one interface in the second assembly).
Improved Legend
We also improved the Legend window, by adding entries for these links, changing the style from being a box (which did not make sense for links) to being a line
Link representation:
And since the Legend Window can now become very big we have:
- Added a scrollbar, which shows-up when the Legend is taller than the document window it is located in.
- Moved the “+” button which is used to add styles from the bottom of the legend to the top of the legend.
Drag and Drop of binaries to a Code Map
The last feature we have added to code map is the ability to drag & drop binaries from the File Explorer and start expanding the assemblies, or asking contextual questions about them.
Let’s see 2 scenarios where you’d want to use this feature.
Understand the pre-requisites of my deployments
Let’s say that I want to install on a build server the assemblies of corresponding to the Code Index SDK, and I want to understand if that will work or if this requires assemblies to be GACed on the server.
I can do the following:
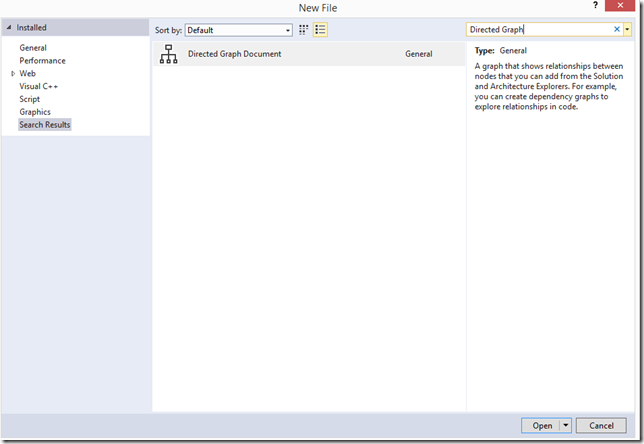
- In Visual Studio, create a new DGML file using File | New Directed Graph
-
Open the file explorer to find the location of the Code Index SDK (%Program Files(x86)MsBuildMicrosoftVisualStudiov12.0Repository)
-
Select the DLLs you are interested in (you could also have used the search “ext:.dll” in the file explorer, that would get all the DLLs recursively, and then select-all
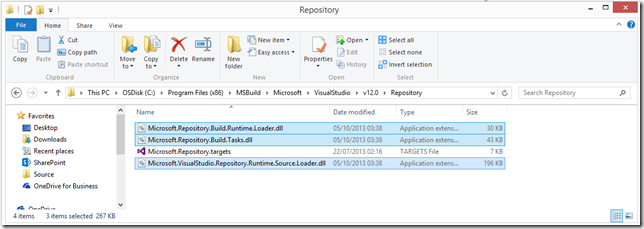
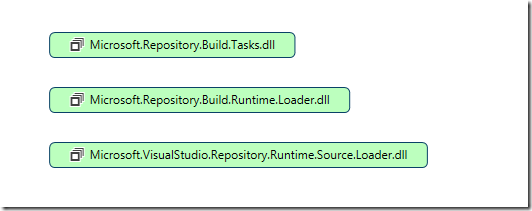
- Drag & drop the assemblies from the file explorer to the empty DGML document which I’ve just created. These assemblies will be indexed, and then added to the diagram, as well as the dependencies between them (in this case there are no dependencies between them).
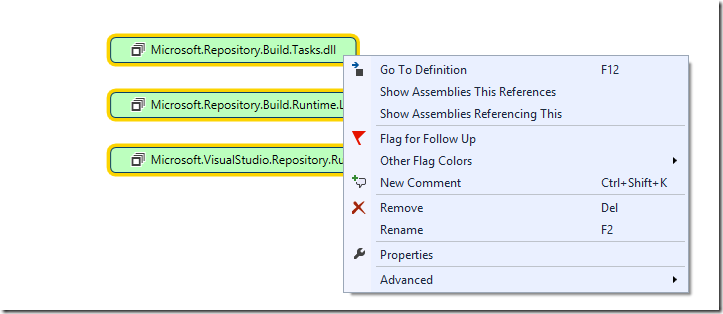
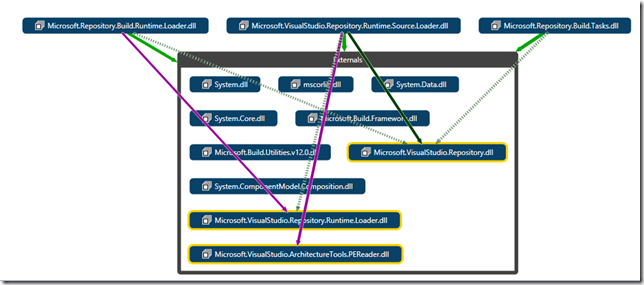
- Select these 3 assemblies and ask which assemblies they depend on (Show Assemblies This references)
You will get the following view

Note that we have not shown this here, but of course you can expand the DLLs that you dragged and dropped in order to understand their namespaces, types etc ..
- Expand the External group
- You will notice that our 3 DLLs depend on 3 DLLs which are not installed on a “normal” machine, but are installed with Visual Studio Ultimate

Therefore you cannot normally deploy the Code index SDK DLLs without installing Visual Studio Ultimate … or installing the DLLs they depend on along with our 3 DLLs (if this is not a violation of the EULA)
Package my assemblies
The last scenario I will consider is the case where I produce DLLs that you want to group and ship in packages, for instance NuGet packages. You want to make sure that you don’t have circular dependencies between your packages, and you want to understand what these dependencies are.
You will want to:
- Add candidate parent groups around the assemblies you want to package
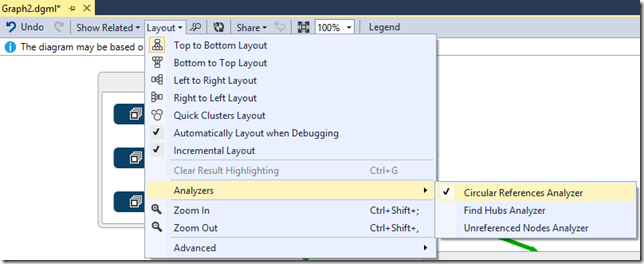
- Enable the circular dependency analyzer (Layout | Analyzers | Circular References Analyzer). The groups will become Red there are circular references.
- Move the DLLs between groups until you are satisfied with your packaging, and there is no circular dependencies
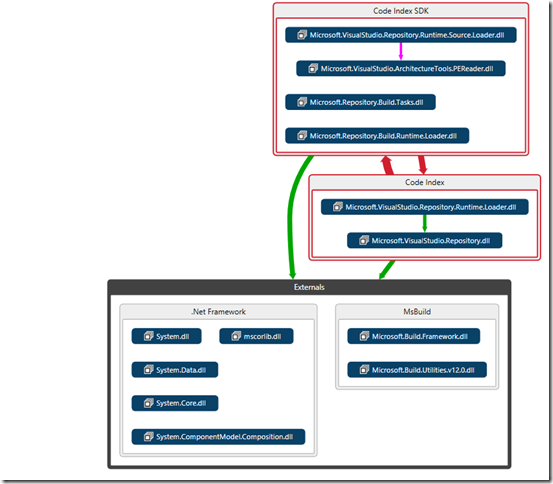
Let’s suppose here I want to package the Code Index SDK along with its dependencies, I add natural parent groups (Code Index SDK, Code Index, .Net Framework, MsBuild)
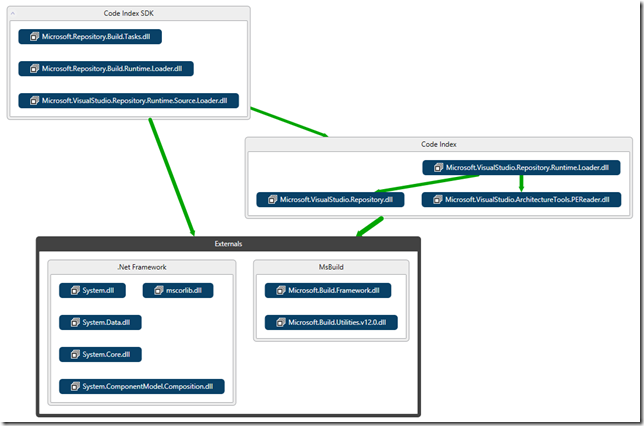
Now let’s suppose I’ve enabled the circular dependency analyzer:
And I’m tempted by moving the PEReader.dll assembly part of the Code Index SDK
If I do that, the Circular Dependency Analyzer will turn red the groups which are implicated in a cycle, and the offending dependency links).
When you have discovered unwanted dependencies, can study what’s causing the dependency in more detail, by right-clicking on a link and requesting Advanced | Show Contributing Links on Code Map
![]()
In Closing
As always, we are interested in hearing your feedback on this feature. Please try it out, and let us know

0 comments