Many folks have noticed I had practically stopped blogging. I have been working on one of the products Brian announced at the launch: Application Insights and as this service wasn’t in preview until today have not been able to blog about it.
For those of you that weren’t able to make the launch, Application Insights is a set of services that provide actionable insight into a production application. This data is then integrated back into the development tools and process. These services include:
- Out-side-in availability monitoring
- Understanding application and system internals with Application Performance Monitoring
- Data driven decisions with customer usage analytics
To ensure all this data is actionable we surface it in a couple of different ways
- Dynamic Reports
- User configurable Email Alerts
- Easy to customize Dashboards
Out-side-in availability monitoring
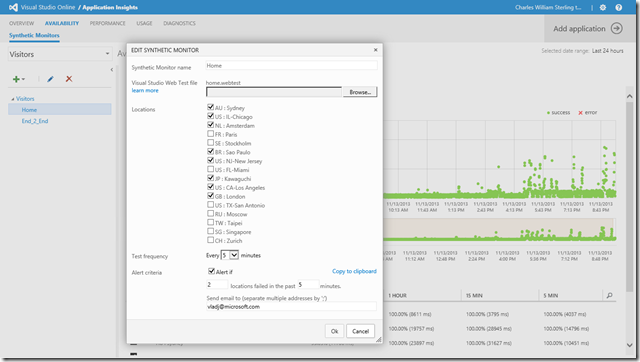
Historically, we would often wait for customers to call the help desk informing us of an outage, even if customers didn’t expect and demand more, in many cases this “call help desk” mindset just doesn’t make sense with globally distributed applications. The days of waiting for a customer to let you know of an outage are (thankfully) long over. To eliminate that dynamic, Application Insights offers availability monitoring that makes it trivial to setup synthetic transactions from either a simple URI or a Visual Studio multi-step Web Test to verify your application is available from 18 locations across the planet –AND show how performant your application is from those locations. In the availability report above, you can see I deployed a version of the application (the blue dot) at which point some of the tests started failing and the entire application slowed down. I then fixed the bugs and did another deployment. This is the second blue dot and clicking on either of these deployment markers will automatically open THAT deployment changeset.
Application Performance Monitoring
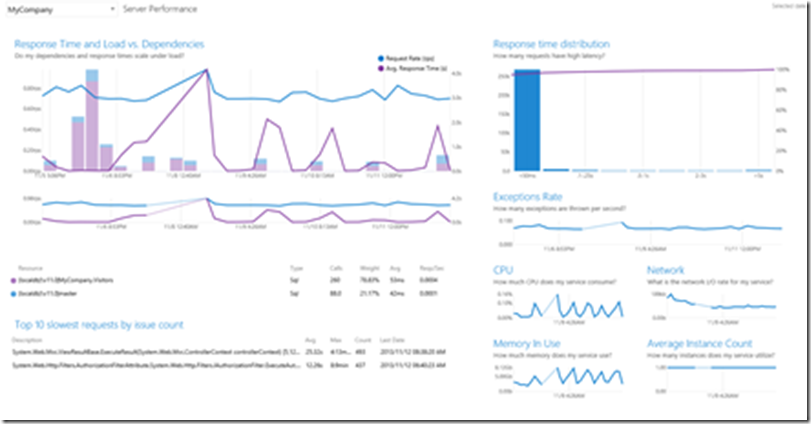
I must admit when I first joined the team they used operation terms I wasn’t familiar with like GSM (for Global System Monitoring) and APM. After using the product and looking at the capabilities, I was CERTAIN **APM **stood for Application Process Monitoring as this service tells me things like exceptions, memory usage, dependency and system information like CPU, request rate, response time, Network IO rate, instance count, memory thresholds and of course performance events. All of this data is served by the same agent as Intellitrace and System Center and integrated with Visual Studio. See blog post Introducing Microsoft Monitoring Agent. “APM” actually stands for Application Performance Monitoring – but our APM service does SO much more than performance monitoring!!!!
Data driven decisions using customer usage
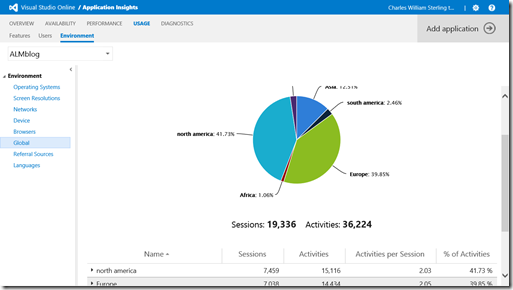
The customer usage service is my favorite service from Application Insights. Add a line of JavaScript to my web application or a Nuget package to my Windows Phone application and I get over 15 reports including information like Operating System, Referral Sources, Pages Usage, Browsers, Location, Networks, Devices, etc. The reason this is my favorite service, it helps make informed decisions when doing our product planning. For instance I instrumented the ALM Blog right after we added the navigation buttons. Adding custom events (another report this service adds) I was able to easily see which buttons people are using.
Making all this data actionable
Application Insights will track an incredible amount of information over long periods of time and we have added several features to make sure it is actionable.
Dynamic Reports
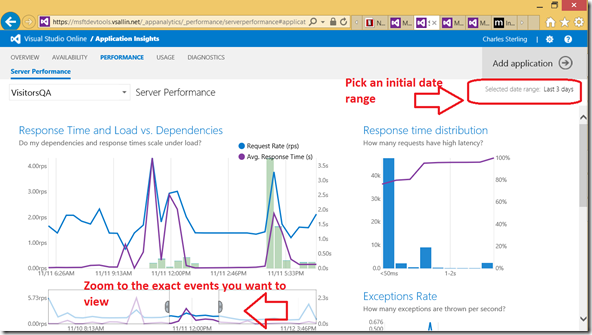
To ensure all the data surfaced by Application Insights is actionable all the repots can easily be factored to just the events you want to examine. At the most course grained you can select time spans then within that time span there are zoom tools to drill into specific events.
Easy to customize Dashboards
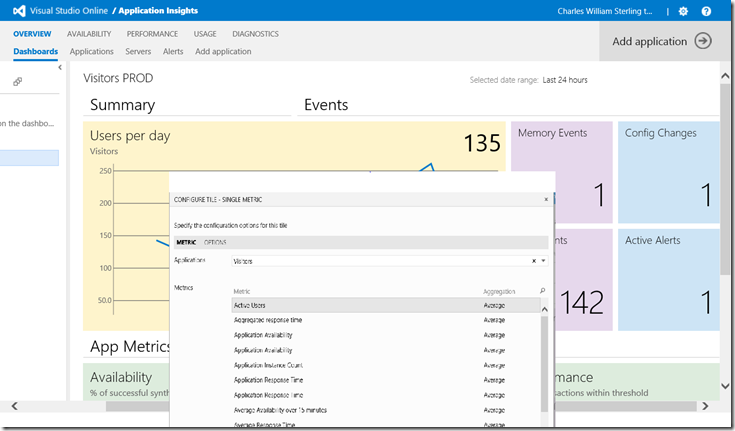
We realize that with all this data, one of the challenges developers would have is just consuming it! To that end Application Insights will automatically create dashboards with the data you need which can be run full screen and even played like a slide show! As you interact with Application Insights and see a metric of particular interest, you can also click on the thumb tack glyph to add it to the dashboard of your choice.
User configurable Email Alerts
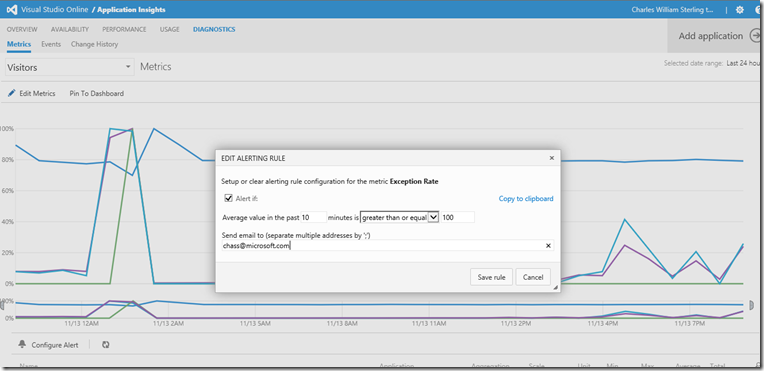
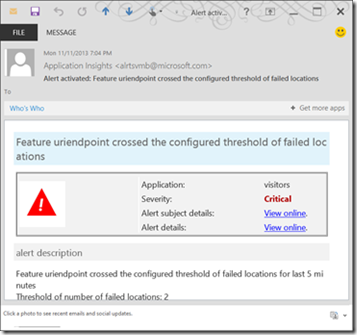
While Application Insights makes seeing the important data easy; sometime this just isn’t enough. For those cases we also enable email alerts to be sent when threshold violations have been exceeded. While these dialogs look relatively simple, the engine driving them is quite sophisticated and can also be controlled through xml files and powershell ( a future blog post to be sure!).
Summary
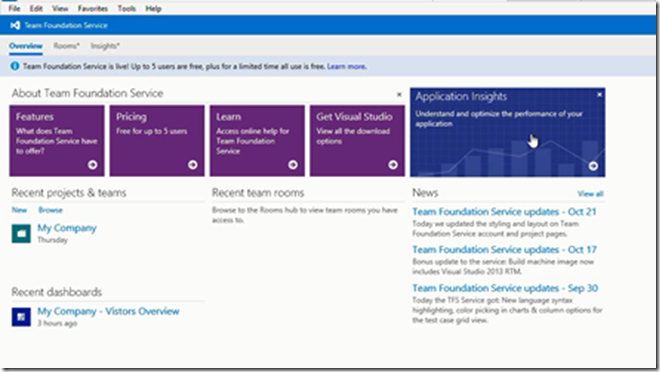
By integrating production monitoring with the development tools Applications Insights will enable higher quality code, decrease rework and further reduce cycle times between releases. So how do you get started? Starting 11/13 9:00am PST we are going to enable a blue box on your Visual Studio online account…access via http://YOURACCOUNT.Visualstudio.com. If you don’t have an account yet you can get one at http://TFS.Visualstudio.com
And for more information please check the new Channel9 series and the new Application Insight forum:
- https://channel9.msdn.com/Series/Application-Insights-for-Visual-Studio-Online
- http://social.msdn.microsoft.com/Forums/en-US/ApplicationInsights/
- http://visualstudio.uservoice.com/forums/121579-visual-studio/category/77108-application-insights
Shortened Links

0 comments