This blog post summarizes the investments we made to our performance profiling and diagnostic tools in Visual Studio 2015.
What’s new in Visual Studio 2015
In Visual Studio 2013 we introduced the Performance and Diagnostics hub. In Visual Studio 2015, we have made the following improvements:
- The Diagnostic Tools are available while you are debugging: you can view CPU Usage, Memory Usage, take snapshots and time sections of code using PerfTips all without stopping your debug session
- IntelliTrace is now part of the Diagnostic Tools resulting in a brand new and easier-to-use experience
- We’ve added new diagnostic tools: Network Usage and Application Timeline
- We’ve added new platform support: Windows 7, Desktop apps, Universal Windows Projects (UWP), and Azure Web Apps
- We’ve optimized our menu entries to accommodate all of the new changes
In the remainder of this post we’ll go into the details of these new and exciting features.
Catch performance issues early using the debugger
Our goal with Visual Studio 2015 was to lower the bar for collecting performance data, so that everyone can measure performance with minimal effort, and without having to leave their typical workflow. To accomplish that goal, we added PerfTips and the Diagnostic Tools window as default debugger features available to Community, Professional, and Enterprise SKUs.
PerfTips show you how long your app was running when you hit breakpoints and step, all you need to do is look at the end of the current line when you are stopped in the debugger to see the elapsed time:

The Diagnostic Tools window records the history of all your PerfTips in the Events graph and in the events table, and also allows you to correlate execution time with the CPU and Memory Usage graphs:
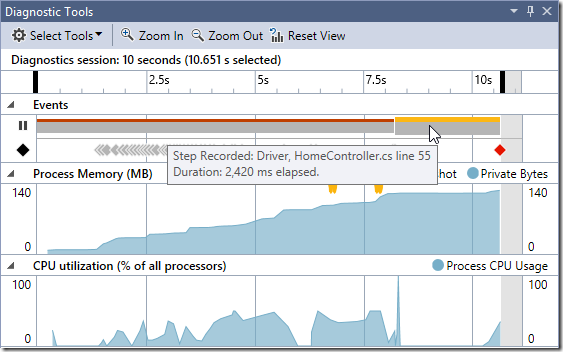
If you switch to the memory usage tab, you can take, inspect, and diff memory snapshots while your program is running or is stopped at a breakpoint:

It is not only easier to measure performance with the debugger, but the added capabilities of the debugger give you more powerful performance analysis tools. You can control program execution and inspect variables to get much better insight into the cause of performance issues. A great example is the ability to inspect variables when viewing the heap captured by snapshots:
This is something that is not possible when using the Memory Usage tool without the debugger.
New IntelliTrace UI and experience
So far everything we have mentioned is in the FREE Community edition of Visual Studio 2015 (and of course the Professional and Enterprise editions as well). In the Enterprise edition of Visual Studio 2015, you will see that we have completely revamped the user interface of IntelliTrace by bringing it into the Diagnostic Tools window. IntelliTrace vastly enhances the debugger by automatically capturing interesting events in your application and surfacing them in the Events graph and the Events tab:
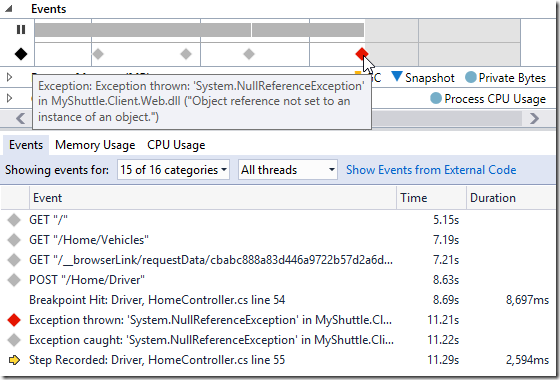
By double-clicking on an event we take you to source code and show you the call stack at the time the event was collected. For example, we can double click on the exception in the screenshot above to see its call stack even though the exception was handled by the app:
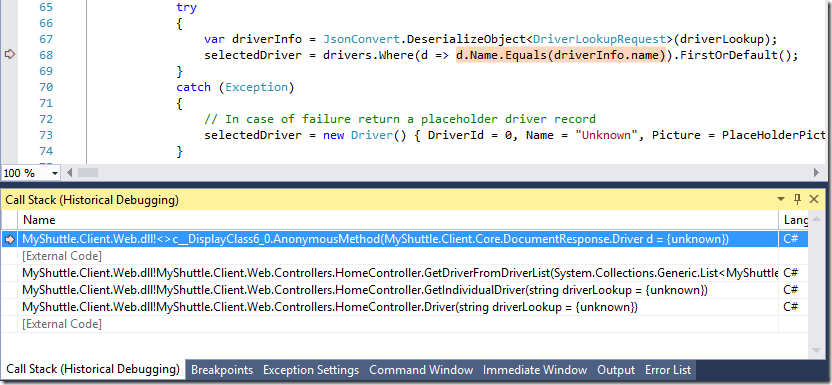
The events that IntelliTrace captures help you to solve tough correctness bugs quickly, and the extra events give you additional insight into performance issues. For example, you can use the timestamps on Debug.Output statements to determine how long it took for code to progress from one line to another.
New diagnostic tools and new platform support
At this point you might be wondering if you still need the ability to run diagnostic tools without debugging, and the answer is a definite “yes”. When you are debugging your app, there is extra performance overhead that your users do not see. The diagnostic tools that run without the debugger provide the comprehensive analysis that is suitable for fine-tuning the Release version of your code, the one that your users get to interact with. For that reason we continue to make improvements to our traditional diagnostic tools that run without the debugger attached, they are complimentary.
In this release we have added two brand new performance tools:
- Application Timeline**. **View a detailed breakdown of the UI thread performance for WPF and Universal Windows Projects and Windows Store apps. This replaces the XAML UI Responsiveness tool, which supported Windows Store apps only.****
- Network Usage**. **View network usage and network performance of Universal Windows Projects that make use of the WinRT HttpClient APIs.****
Of course, you can continue use same great performance tools that were available in Visual Studio 2013. As a reminder, the following tools were added in updates to Visual Studio 2013:
- CPU Usage**. See **which of your C#, VB, C++, or JavaScript functions are using the CPU the most.****
- GPU Usage**. **See how your application is making use of the GPU, and get an understanding of the CPU/GPU interactions.****
- Memory Usage**. **Monitor memory usage and take snapshots of your C#, VB, and C++ code so that you can inspect the contents of the heap and find memory leaks.****
… and the following are the tools that were available in Visual Studio 2013 RTM:****
- JavaScript Memory**. **Memory usage and find memory leaks in JavaScript Universal Windows Projects and Windows Store apps.****
- HTML Timeline**. **This tool helps you isolate UI performance problems in JavaScript Universal Windows Projects and Windows Store apps by providing rich visualizations of work being done on the UI thread.****
- **Performance Wizard. **Our legacy profiling tools that we continue to offer for desktop executables and ASP.NET applications. ****
As you would expect, all of these tools (except for the Performance Wizard) work with the new Universal Windows Projects. We have also enabled some of our diagnostic tools for Desktop applications on Windows 7, which is an important capability for many of our developers. Our CPU Usage, Memory Usage, Application Timeline, and Performance Wizard are all available on Windows 7.
One final capability worth mentioning is our support for running the CPU Usage tool on a production Azure Web App. If your site is a Basic or Standard site, you can right-click on your site in Server Explorer and select Start Profiling:
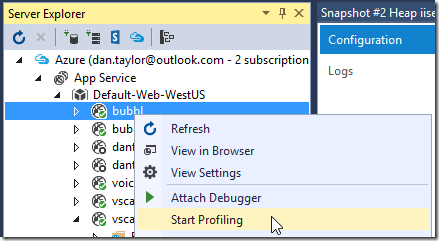
After you start profiling you can right-click and select Stop Profiling to see the CPU Usage report in Visual Studio. You can also collect a profile by browsing to the Azure App Service’s Site Control Management dashboard (kudu). For more information, check out the Azure SDK 2.7 for .NET announcement.**
Updated menus: where is the profiler?
Finally, we have made changes to menus to keep up with all of the new features. In Visual Studio 2013 the profiler was available on both the Debug menu and the Analyze menu. From the Analyze menu, you could get to both the new Performance and Diagnostics hub and the older Performance Explorer. In Visual Studio 2015 we have removed the entries from the Analyze menu and consolidated them on the Debug menu so that we can direct everyone to one optimized set of menu entries for Diagnostic Tools. This may leave some users wondering “where is the profiler in Visual Studio 2015?”, but no need to worry, it is still there!
If you open the Debug menu, you will now see three menu entries for the Diagnostic Tools:
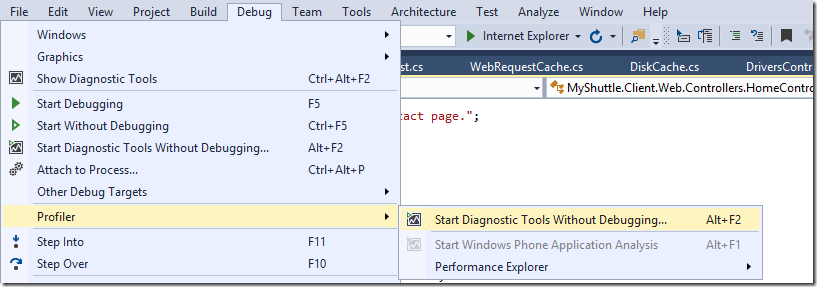
- **Show Diagnostic Tools (Ctrl+Alt+F2). **This opens the Diagnostic Tools Window which allows you to use the Diagnostic Tools while you are debugging. This window appears automatically when you start debugging a supported project and debugging configuration.
- Start Diagnostic Tools Without Debugging (Alt+F2). This brings you to the Diagnostic Tools launch page to run the Diagnostic Tools without attaching the debugger so that you can profile your app without any debug overhead affecting the results. This is the equivalent to Performance and Diagnostics hub in Visual Studio 2013.
- **Profiler. **This menu entry is for existing users who are familiar with the word “Profiler”, and includes both our new Diagnostic Tools, and the old Performance Explorer. The Performance Explorer is still available here because it provides advanced features (such as profiling using Attach to Process) that we have not yet implemented in the newer diagnostic tools.
So there you have it, all of our new and existing Diagnostic Tools can be found on the Debug menu.****
Feedback and resources
We are excited about the new debugger-integrated Diagnostic Tools and the capabilities it enables for you as a developer. We are continuing to expand on our Diagnostic Tools platform so keep your eyes peeled for new features in coming releases! If you try out any of the features mentioned in this blog post, please give us your feedback so that we can improve. You can leave general comments & questions at the end of this blog post or from within Visual Studio using Send-a-Smile, and submit feature requests to our Diagnostics UserVoice.
If you would like to know more, be sure to check out the following walkthroughs:
- MSDN Magazine: Analyze Performance While Debugging in Visual Studio 2015
- MSDN Magazine: Use IntelliTrace to Diagnose Issues Faster
- Blog post: Diagnosing Event Handler Leaks with the Memory Usage Tool in Visual Studio 2015
- Video: Historical Debugging with IntelliTrace in Microsoft Visual Studio Ultimate 2015
- Video: Debugging Performance Issues Using Visual Studio 2015
Enjoy!


0 comments