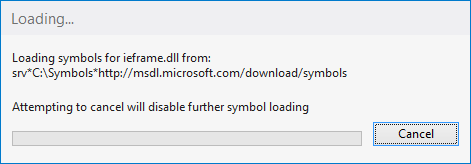
You will recall that VS2012 Update 1 brought a bunch of symbol loading improvements for your debugging scenarios, as documented in our previous two blog posts
- Debugger Source Symbol Improvements to Visual Studio 2012
- More on symbol improvements in VS2012 Update 1
You’ll be happy to hear that with Visual Studio 2012 Update 2 we’ve taken these symbol related improvements one step further and applied them to more diagnostics scenarios.
Specifically, the same symbol loading logic updated for the debugger in Update 1 is now used in the following scenarios improving both performance and usability:
- IntelliTrace scenarios: live debugging with IntelliTrace enabled as well as debugging IntelliTrace log (.iTrace) files now benefit from the symbol loading improvements.
-
Analyzing performance data in Windows Store apps and CPU sampling profiling on Windows 8 in general: when analyzing a .vspx profiler report symbols are loaded the same way as in debugging scenarios: you will see the same cancellation dialog:
 Note: If you cancel symbol loading and change symbol settings, you will need to reopen the report file to reload the symbols.
 -
Manual symbol loading through the Modules window during live debugging is now plumbed through the same improved mechanism: it is cancellable and benefits from caching and other improvements.
As always, we want to hear your feedback. Feel free to leave your comments below, and for general debugger, profiler and IntelliTrace questions please use Diagnostics MSDN forum.

 Note: If you cancel symbol loading and change symbol settings, you will need to reopen the report file to reload the symbols.
0 comments