

Background
Event stream processing is one of the common IoT scenarios that we observe in the manufacturing industry. Our customer was looking for an event stream processing solution to process all telemetry data generated by several sensors in their office building in real-time. The events that were sent to Event Hub contained roughly 70k telemetry data per second in total, which is around 10 MB per second in terms of package size.
The following shows the overall architecture of our solution:
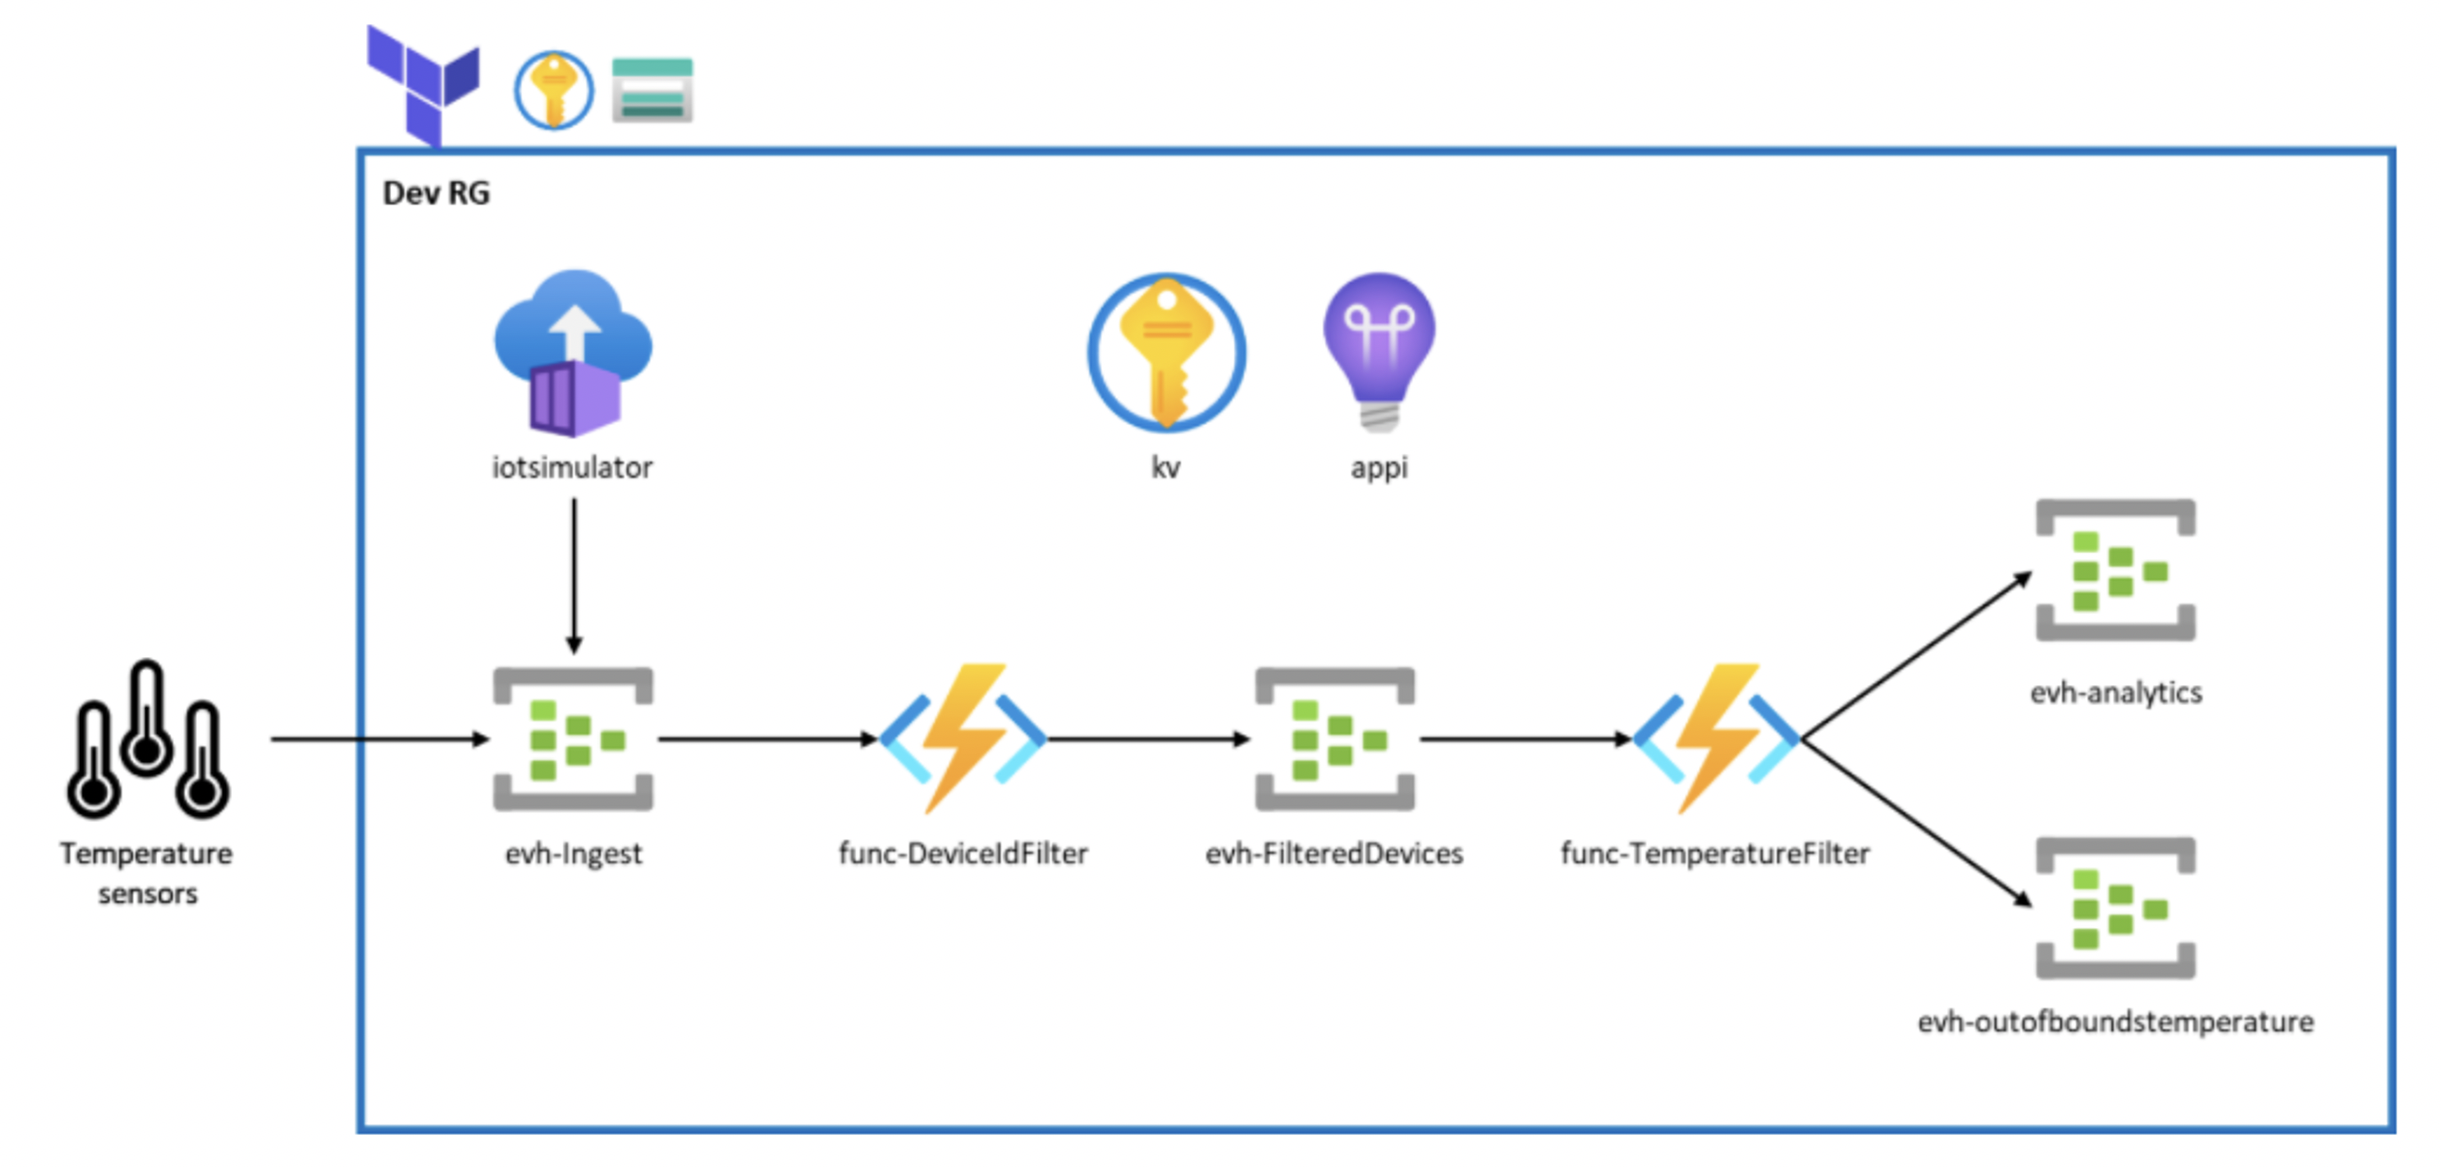
The event streaming solution that we came up with, also shared in this public DataOps repo, demonstrates how Azure Event Hubs can be used to stream the telemetry data, and serverless functions can be utilized to filter, process, and split the stream. We have an IoT simulator that simulates the actual sensors that are sending the event stream. That telemetry data is streamed to an Azure Event Hub. Event-triggered Azure Functions will process events in batches, and push to the next Event Hub for further processing.
In this event streaming scenario, performance is critical to ensure that processing does not ‘fall behind’ the rate that new events are sent. Meaning that, this solution will need to scale fast and be capable of handling the large load.
Challenges and Objectives
As we finished building most of the parts in our system, we wanted to move on to understand the performance of the system. We needed to understand if our system’s performance meets our customer’s requirements in terms of the expected load. Here are some performance benchmarks that we were interested in for this event streaming scenario:
- Can our system handle the expected load of events? Any bottleneck or failures?
- How many Azure Functions instances are required to handle the load?
- How long does it take for an event to be processed since generated?
To understand these performance benchmarks, “Observability” became an important aspect that we needed to look into. With good observability in place, we can easily monitor the health and performance of our system. We can also perform several load tests with some tweaks in the system and be able to know the influence in performance right away.
The following sections will explain how we easily gained insight into these performance metrics listed above thanks to the rich visualizations in Azure Application Insights.
Solution
Azure Functions offer built-in integration with Application Insights. From App Insights, you can get information such as the number of Azure Function instances, request and dependency telemetry of the Azure Function, etc. When working with event-triggered Azure Functions with Event Hub, App Insights is also capable of tracking the outgoing dependency telemetries to Event Hub, calculating the time spent in Event Hub queue (image 3), showing the end-to-end flow of the system connected through Event Hubs (image 2), and so on.
This section introduces four useful features and insights you can get from App Insights: Application Map, End-to-end transaction details, number of Azure Function scaled instances, and end-to-end latency.
1. Application Map
Application Map shows how the components in a system are interacting with each other and shows the average of each transaction duration. The transactions that contain failures are marked in red. The percentage of the failing transactions are also indicated aside. From Application Map, you can easily tell which part of the system is failing, or which part of the system might be causing a bottleneck and needs improvement.
After sending the expected load to your system, you can go to App Insights in the Azure portal, and on the sidebar, click on Application Map. You may need to press “update map components” if the components are tracked by different App Insights.
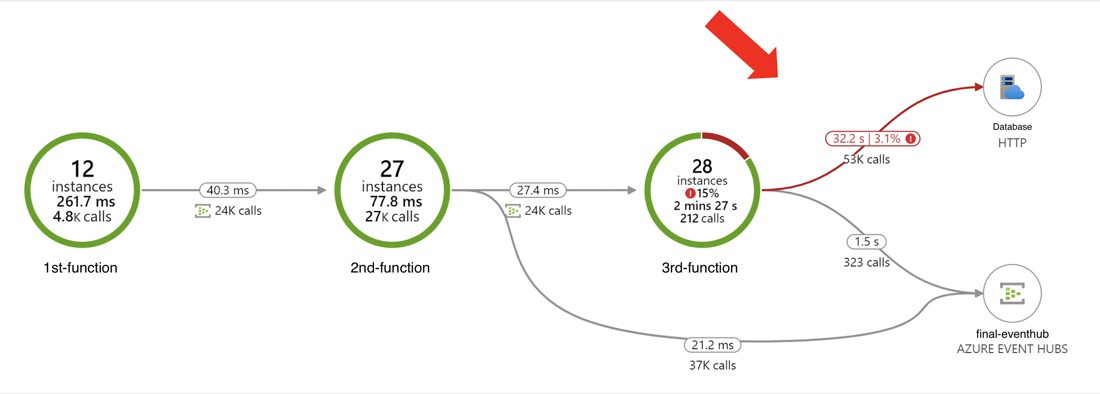
From the screenshot above, we could easily tell that our calls to the database are having some issues. By clicking directly on the arrows, we can drill into some metrics and logs for those problematic transactions.
2. End-to-End Transaction Details
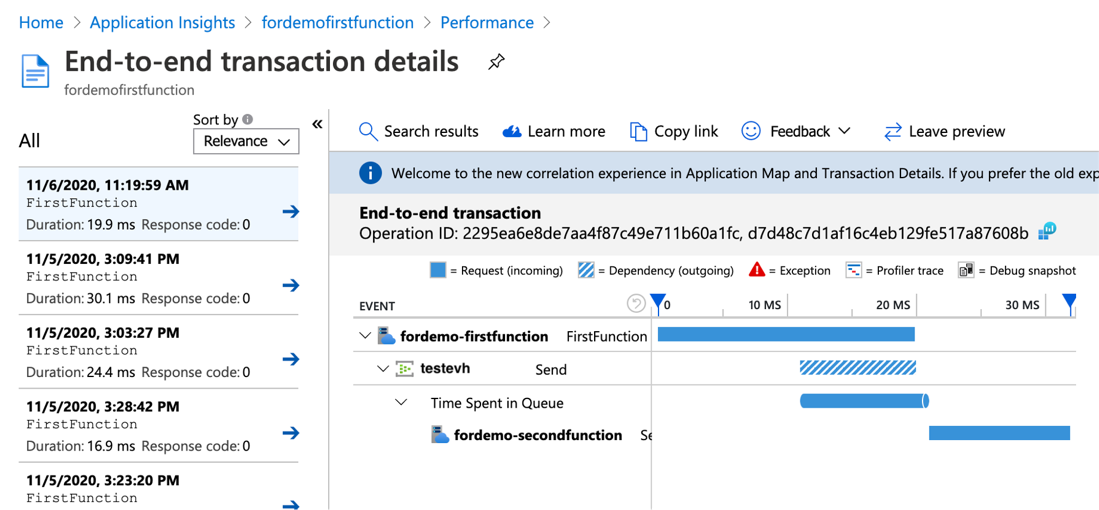
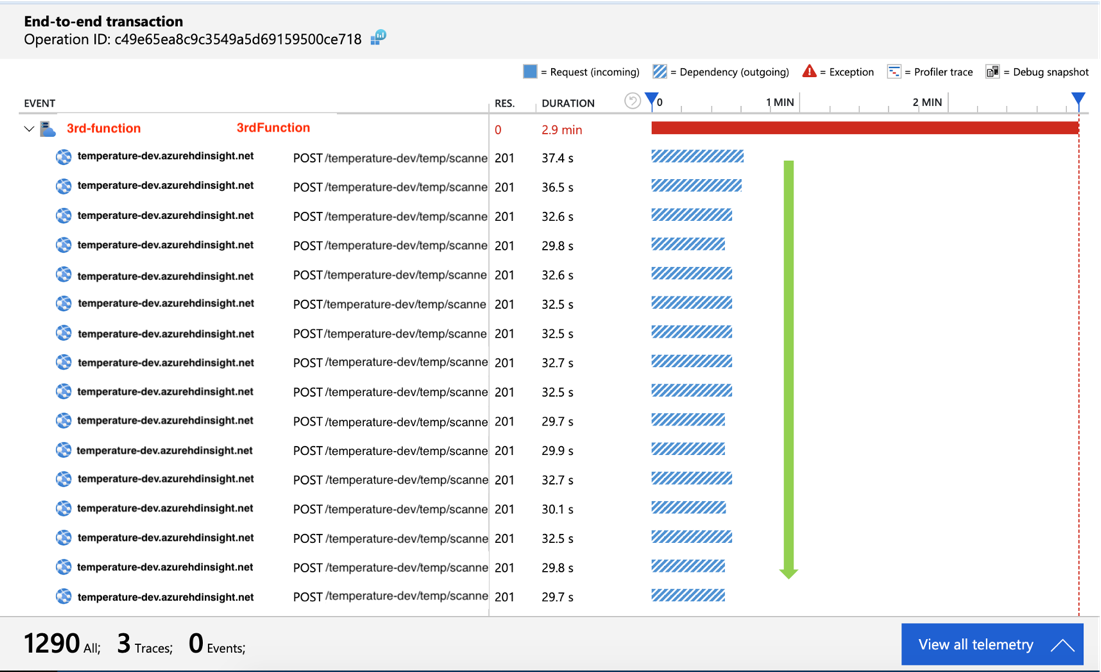
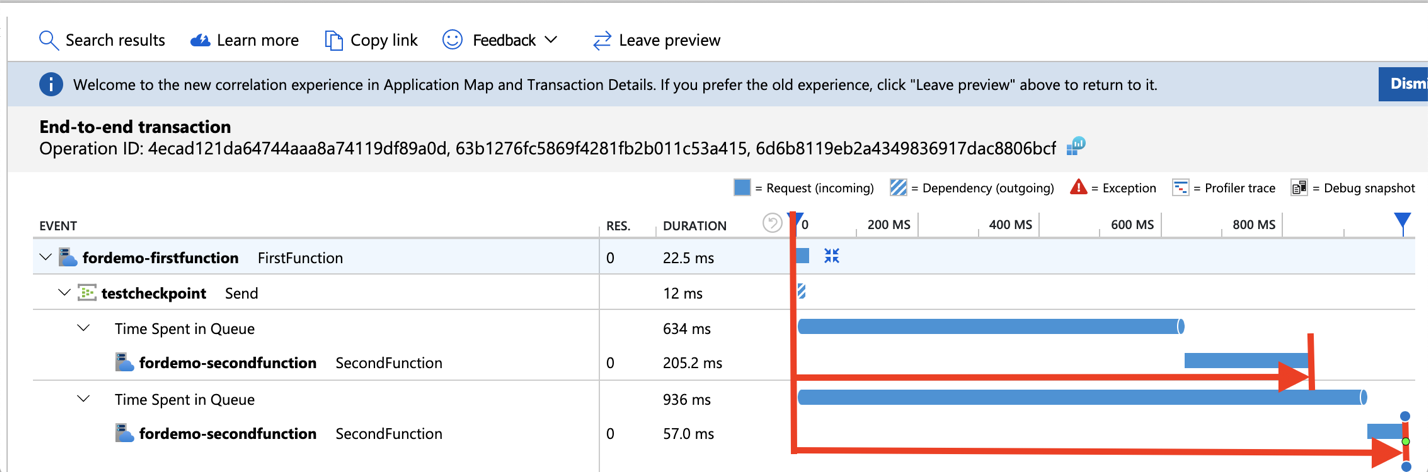
End-to-end transaction details show how your system components interact with each other in chronological order. This view also shows how long an event is spending in the Event Hub queue with some backward calculation. You can also drill into the telemetry of each component from this view, which makes it easy to troubleshoot across components within the same request when an issue occurred.
As soon as we drilled down into the problematic transactions and looked at the timeline, we realized that our outgoing calls for each event are waiting for one and another to finish before making the next call, which is not very efficient. As an improvement, we changed the logic to make outgoing calls in parallel which resulted in better performance. Thanks to the visualization, we were able to easily troubleshoot and gain insight on how to further improve our system.
3. Azure Function Scaled Instances
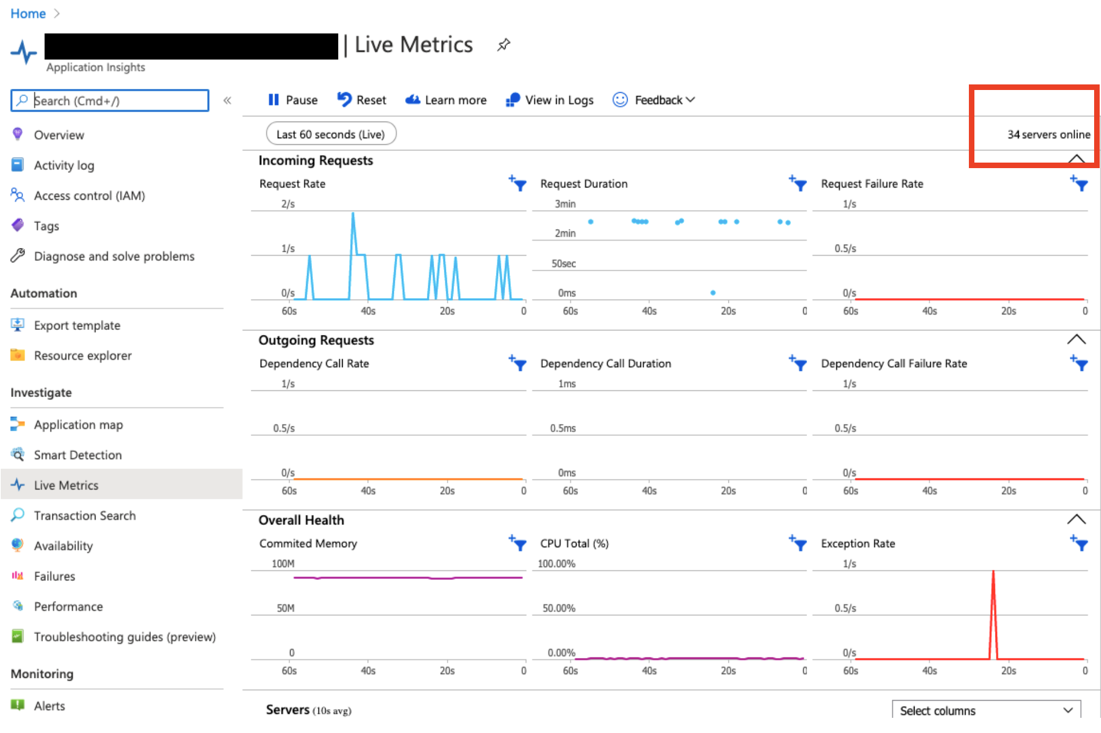
While Application Map also shows you how many instances that Azure Function scaled to within the selected period, from Live Metrics, you can see how many instances Azure Function has scaled to in real-time.
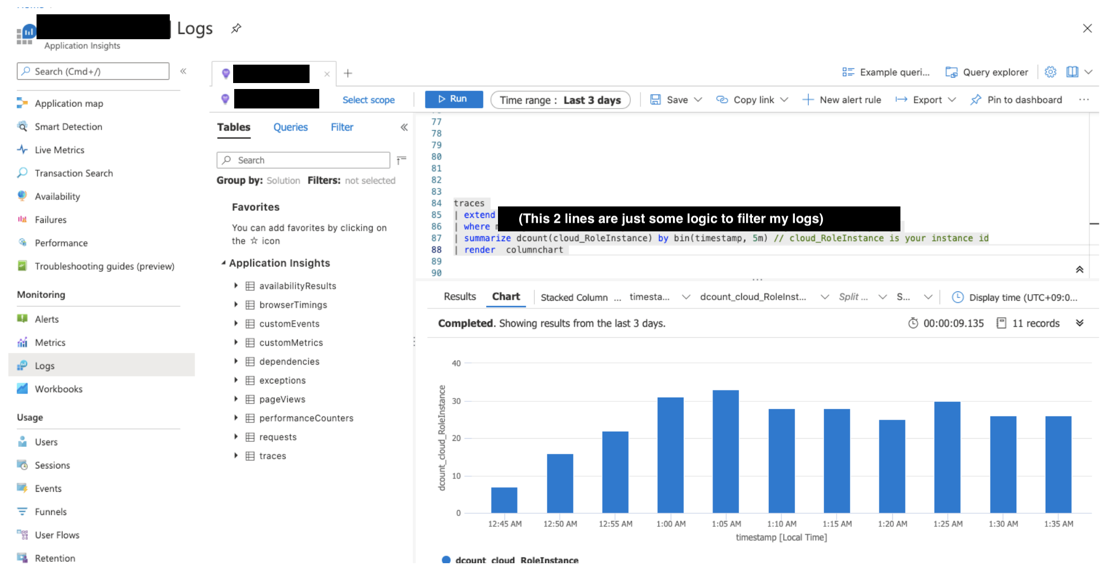
However, the number of function instances is not available from any default metrics at this point. If you are interested in how the number of Azure Function instances changed over a period of time, or would like to know how many instances that Azure Function had scaled to in the past, you can query the logs in Log Analytics (also possible within Application Insights) by using this Kusto query below:
traces
| where ......// your logic to filter the logs
| summarize dcount(cloud_RoleInstance) by bin(timestamp, 5m)
| render columnchart
4. End-to-End Latency
At first sight, it may be tempting to think that we can get the end-to-end latency by just adding up these number of average durations in Application Map. However, if you check the end-to-end transaction details, you will realize that depending on how you implement the logic, function duration can include the dependency call duration, or even last longer than the second function. Also, “time spent in queue” (third bar in the screenshot below) will not be reflected in the Application Map. Therefore, calculating end-to-end latency with Application Map can be tricky since there might be some actual overlaps or latency that are not reflected.
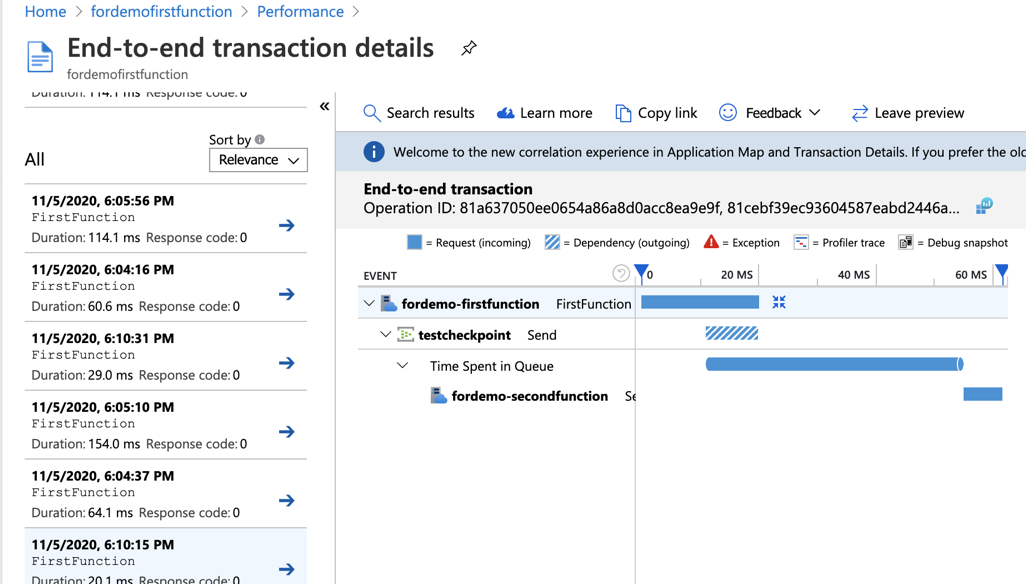
Instead of Application Map, getting the end-to-end latency from the ‘End-to-end transaction details’ page does look promising. You can look into one of the requests and get a rough idea of the end-to-end latency. In fact, these visualizations are generated on top of the collected telemetry by App Insights. So, to get an average of these end-to-end latency, you can query the collected telemetry in App Insights and calculate it by yourself.
However, this approach depends on what end-to-end latency you plan to calculate. With the default telemetry collected by App Insights, you can only calculate latency from the start of function execution, instead of event enqueued time:
In fact, you might also realize that there is an “enqueueTimeUtc” property in the trigger detail trace. This enqueue time is extracted from only the first event of each batch that function processed. So, if the maxbatchsize of your function is set to 1, then you might be able to calculate the end-to-end latency by using this event enqueue time property. However, in most cases, it is more efficient to process events in batches. In those cases, there is a risk of using the first event’s enqueued time to represent the enqueued time for the rest of the events in the same batch.
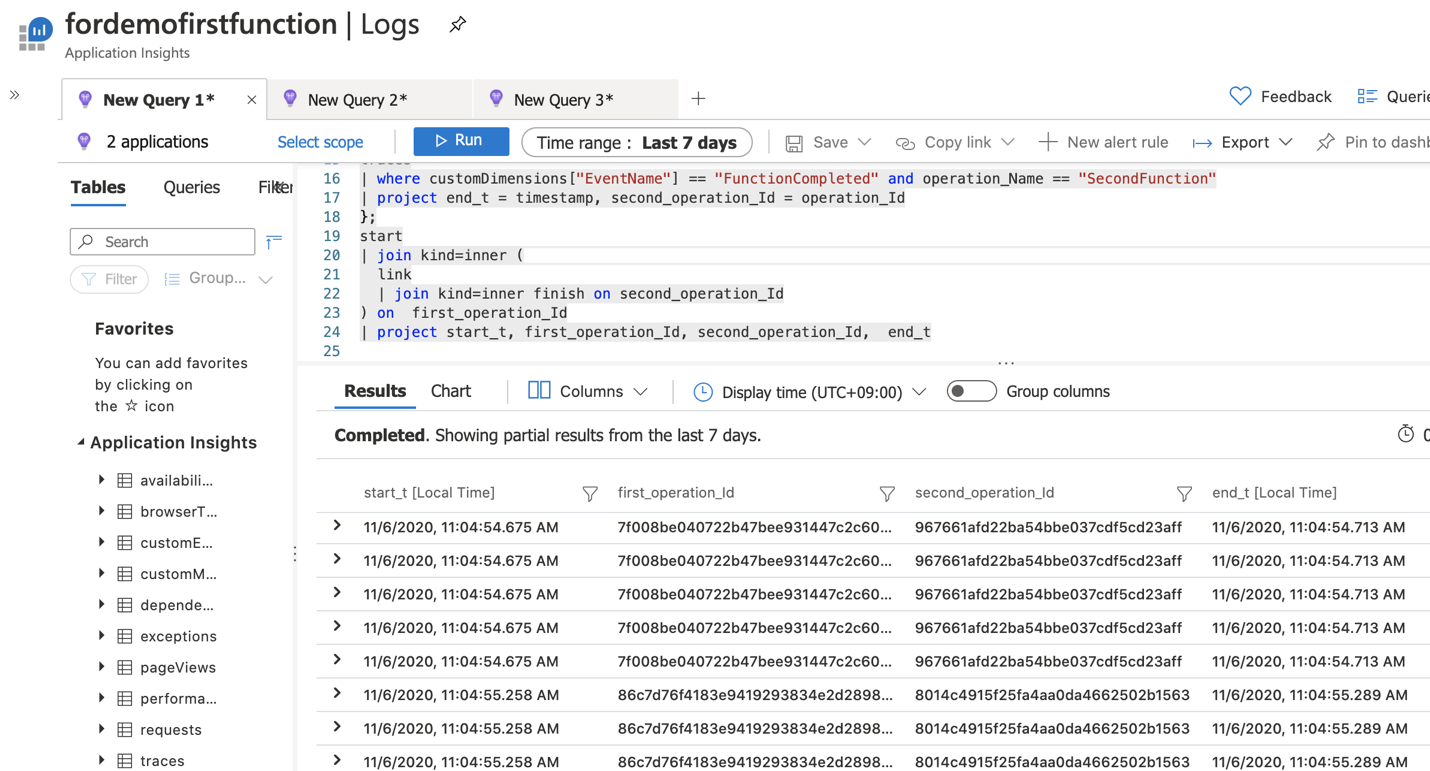
Here is a sample Kusto query that you can use to calculate the end-to-end latency from “first function receives events” until “second function ends”:
let start = view(){
requests
| where operation_Name == "FirstFunction"
| project start_t = timestamp, first_operation_Id = operation_Id
};
let link = view(){
requests
| where operation_Name == "SecondFunction"
| mv-expand ex = parse_json(tostring(customDimensions["_MS.links"]))
| extend parent = case(isnotempty(ex.operation_Id), ex.operation_Id, operation_Id )
| project first_operation_Id = parent, second_operation_Id = operation_Id
};
let finish = view(){
traces
| where customDimensions["EventName"] == "FunctionCompleted" and operation_Name == "SecondFunction"
| project end_t = timestamp, second_operation_Id = operation_Id
};
start
| join kind=inner (
link
| join kind=inner finish on second_operation_Id
) on first_operation_Id
| project start_t, end_t, first_operation_Id, second_operation_Id
| summarize avg(datetime_diff('second', end_t, start_t))
What this Kusto query does is that it will expand the operation links (if any) in the second function’s request and map the second function’s end time to its corresponding first function’s start time. When there are no operation links, it means that the function only processed one event during that invocation, so the first function’s operation ID will just be the same as the second function (the operation links are explained in the next section).
While the function start time to function end time’s latency gives you some idea of a portion of your system, some projects might need to know more about the latency that is not covered by what was logged by default. For instance, as mentioned previously, you might want to calculate the end-to-end latency by using the event’s enqueued time. You might even want to define end-to-end latency based on some business metrics. In those cases, you can calculate the latency from your application and log it to App Insights. You can include timestamps of the start time in each event and log the calculated latency of each event at the end of your system.
One thing to remember when doing so is to log the latency with “structured logging”. For example:
double latency = (nowTimeUTC - enqueuedTime).TotalMilliseconds;
log.LogInformation("latency: {latency}", latency);
This way you will be able to query the property easily in App Insights by using “customDimensions.prop__{yourProperty}”. Beware that there are two underscores in this expression.
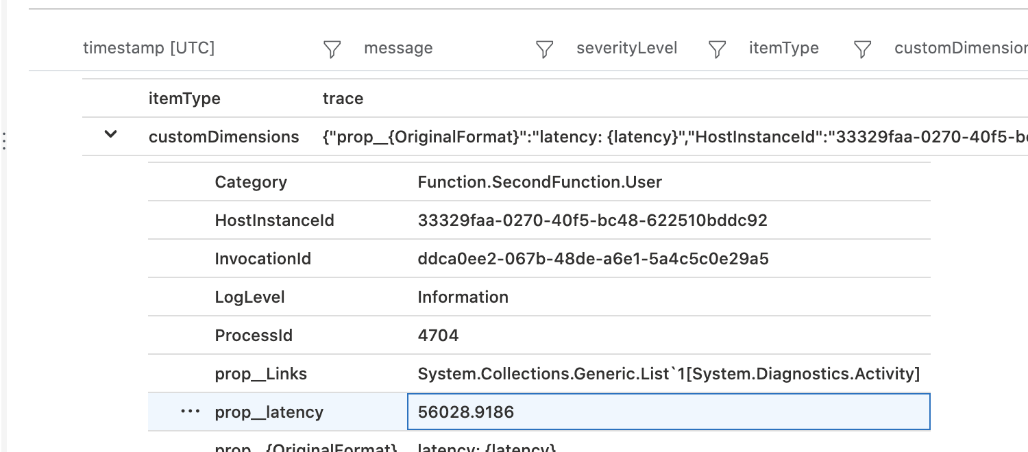
Here is an example Kusto query to calculate the latency based on your logs:
traces
| where operation_Name == "SecondFunction" and isnotempty(customDimensions.prop__latency)
| summarize avg(todouble(customDimensions.prop__latency))
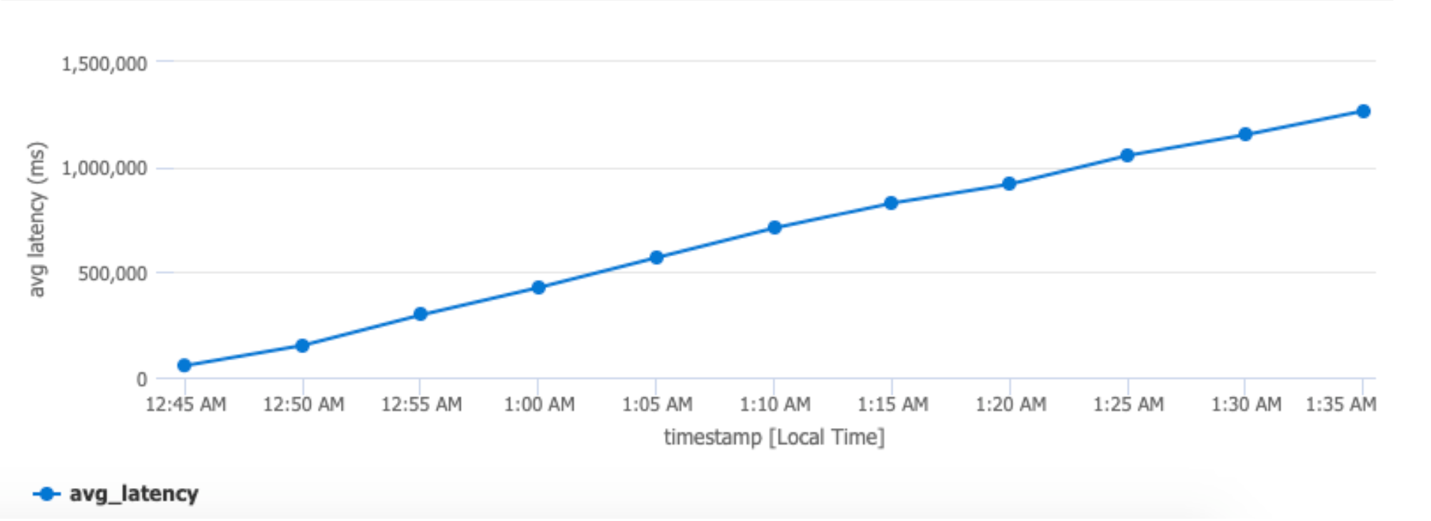
By using Kusto query, you can also draw some charts to gain some insight into how the latency changes from time to time:
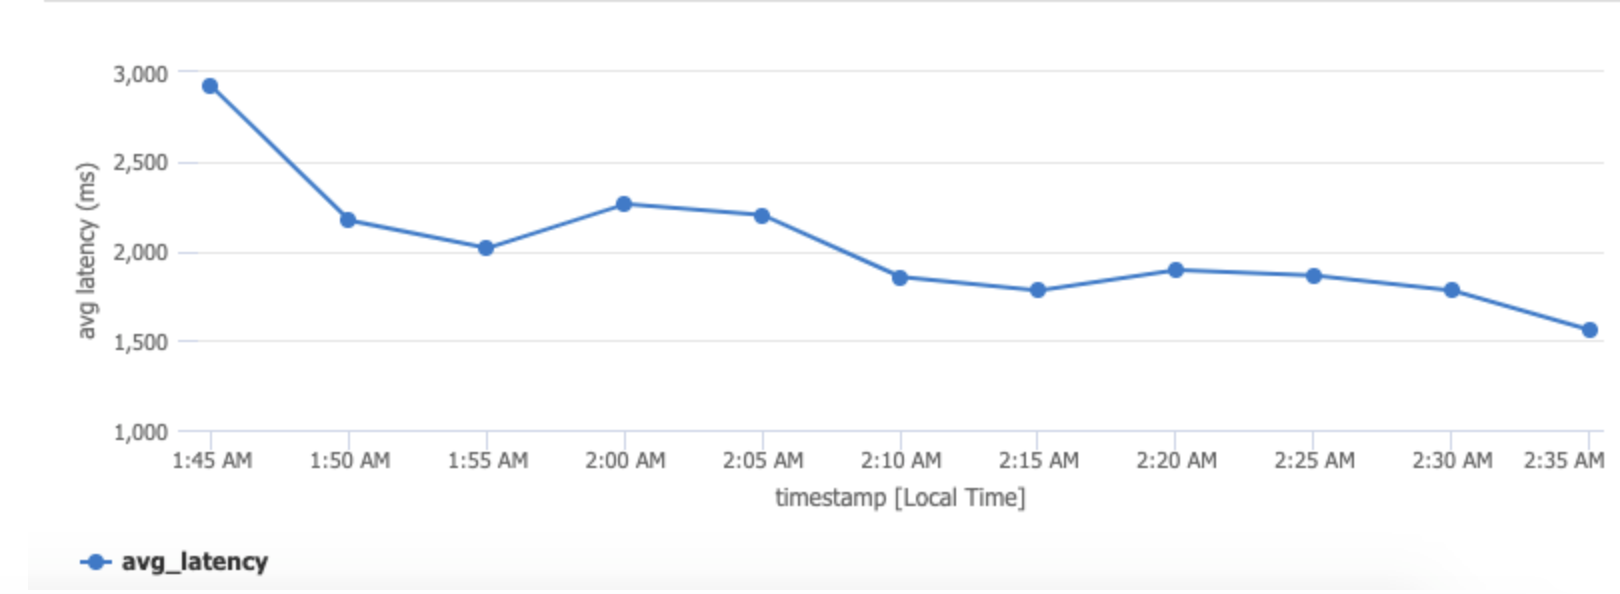
If the latency keeps increasing as the chart below, it means that the system is not able to handle the load and the events are stacking up.
Last but not least, you can use the sampling feature of App Insights to reduce the logs that are sent to App Insights. You might not want to calculate latency for every event if you have hundreds of thousands of events.
Distributed Tracing with App Insights Deep Dive
Distributed Tracing is one of the key reasons that Application Insights can offer rich visualizations such as Application Map or End-to-end transaction details that show end-to-end information of your system. In our system, events flow through several Azure Functions that are connected by Event Hubs. Nevertheless, Application Insights can collect this correlation automatically. The correlation contexts are carried in the event payload and passed to downstream services.
The previous sections introduce several features that can help you gain insight into your system with just a few clicks. This section will explain how the distributed tracing for App Insights works behind the scenes to provide features such as Application Map.
1. W3C Trace Context and C# Activity class
W3C Trace Context is a shared standard for distributed tracing among different monitoring tools. As the official doc mentioned, App Insights is transitioning to W3C Trace Context and the Correlation Http protocol, also called Request-Id, is being deprecated.
When working with services that communicates through HTTP, this correlation context, following the W3C Trace Context format, will be injected into the HTTP headers as the following:
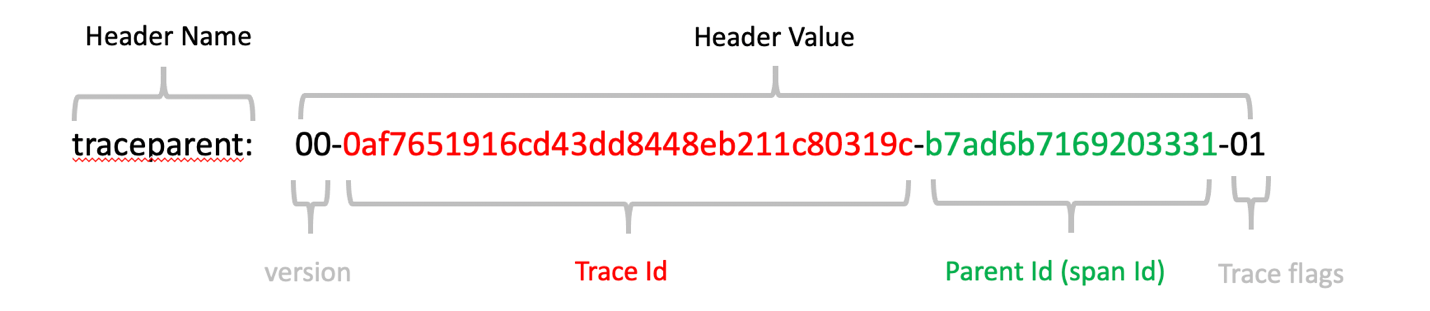
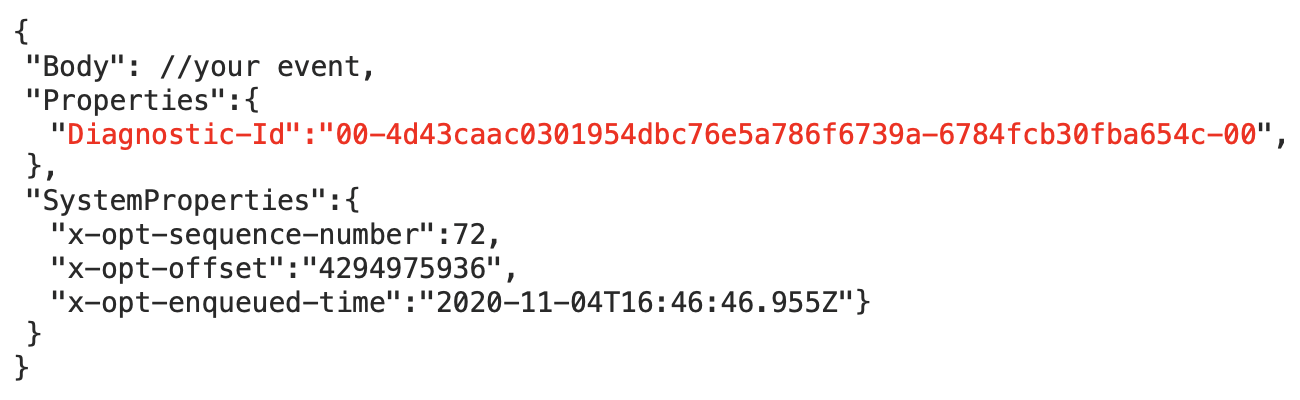
When working with non-HTTP, such as Event Hubs, it needs to find a way to pass the same correlation context to the downstream components. For Event Hubs, this correlation is injected into the event payload. In the events you will see a “Diagnostic-Id” property, where its value still follows the W3C Trace-Context Protocol.
The correlation context will be stored in Azure Functions using C# Activity class. C# Activity class is basically a class in C# that stores the context and helps you achieve distributed tracing. Activities are stored using AsyncLocal so that you can access this activity from anywhere in the call graph. The App Insights SDK will then get the information it needs from activities to construct the telemetry to send to App Insights. The Event Hub client also relies on the activities, to get the correlation context from activities and inject it into the events to pass down the correlation context.
2. Understanding operation IDs & operation links when working with Event Hubs:
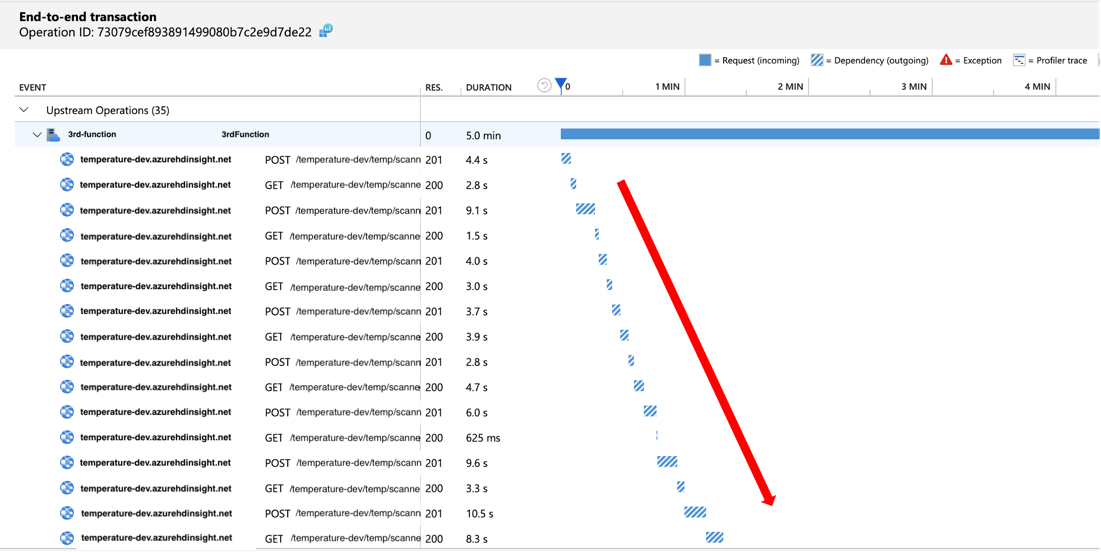
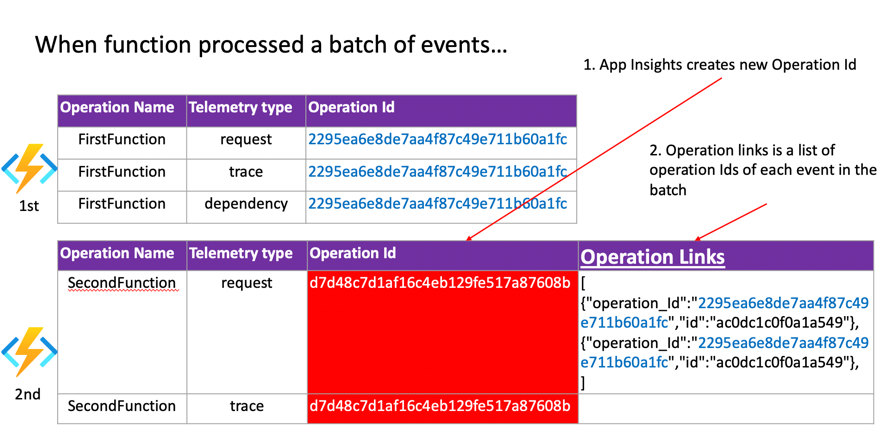
Trace IDs are called Operation IDs in App Insights. Throughout a request, the telemetry should share the same operation ID in App Insights. When your Azure Function processes only one event at a time, you will see that your first function and second function, with Event Hubs in between, will share the same operation ID. However, when your function processes a batch of events at a time, you will see that your single request will contain multiple operation IDs, as shown in the screenshot below:

The reason is that each event within a batch could be processed by different function invocations and can have different trace IDs. Those events that are processed within different upstream requests are just pushed into a queue, and the next function can pick them up within the same request. Using any of the trace IDs cannot represent the rest of the events. So instead of using any of the trace IDs, it will create a new trace ID for your second function and append the trace IDs of each event to a new property named “Operation links”. The first and second function will have different operation IDs, but App Insights will be able to correlate them by deriving the relationship from operation links.
Summary
The biggest takeaway for us is that Azure Event Hubs works well with Azure Functions in terms of distributed tracing. With distributed tracing handled by Azure Functions, Event Hub, and Application Insights behind the scenes, many of our challenges can be solved easily, especially Application Map and End-to-end transaction details that helped us quickly identify bottlenecks and troubleshoot failures by providing an end-to-end overview of the system.
Indeed, we can combine what we learned from Application Insights with other metrics provided in Azure, such as the ingress and egress rate of Event Hub, to make more thorough analysis for the system. You can find more detail of this part in the related works section below. We hope this blog gives you some idea about how App Insights can help you monitor the performance of your system if you are working on a similar event streaming scenario.
Acknowledgment
This project was a team effort and here are the main contributors for this engagement: Vaughan Knight (MSFT), Ian Chen (MSFT), David Burela (MSFT), Rex Tang (MSFT), Hannes Nel (MSFT), Jason Mostella (MSFT), Masayuki Ota(MSFT), Akira Kakkar (MSFT), Shervyna Ruan (MSFT).
Related works
- Temperature Events DataOps Github repo:
- Shervyna Ruan – Calculating End-to-End Latency for Event Hub Triggered Azure Functions with App Insights
- Shervyna Ruan – Distributed Tracing Deep Dive for Event Hub Triggered Azure Function in App Insights
- Masayuki Ota – Load test for real time data processing
- Masayuki Ota – Consideration: Scaling Out Azure Functions With Event Hubs Effectively
- Masayuki Ota – Scaling Out Azure Functions With Event Hubs Effectively 2
- Akira Kakkar – Observability on Event Hubs