
Emotion Detection and Recognition from text is a recent field of research that is closely related to Sentiment Analysis. Sentiment Analysis aims to detect positive, neutral, or negative feelings from text, whereas Emotion Analysis aims to detect and recognize types of feelings through the expression of text, such as anger, disgust, fear, happiness, sadness or surprise. Emotion Analysis has many useful applications such as gauging how happy our citizens are, or enabling pervasive computing to tailor responses to the individual. Using machine learning, an application could use Emotion Analysis to suggest help when anxiety is detected, or to tailor a response to how a consumer feels about a product or service.
In this code story, we will explore the use of neural networks in Emotion Detection and Recognition. Neural networks allow us the flexibility to define a topology, from number of neurons to number of hidden layers. Many have said that designing the topology is an art rather than a science. This case study explores whether:
- More layers yield better overall performance, from 1 hidden layer, to 5 hidden layers
- More neurons, from 5 to 125 neurons, yield better overall performance in a 1 hidden layer neural network, when applied to emotion analysis from informal short English text (see here for this case study). The number of neurons in both cases is arbitrary.
The data
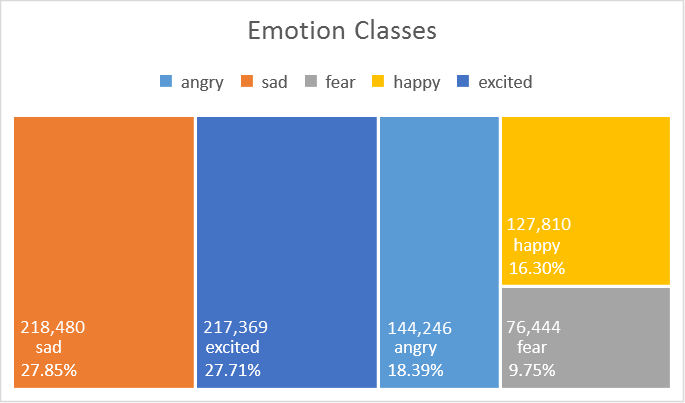
The dataset used in this experiment (see here for details) consists of 784,349 sample informal short English messages, with 5 emotion classes: anger, sadness, fear, happiness, excitement, where 60% is used for training, 20% for validation and 20% for testing. Bi-grams of those text messages are used as emotion features. This is currently a private dataset.
Results and Discussions:
| 1 Layer | 2 Layers | 3 Layers | 4 Layers | 5 Layers | ||||||
| Accuracy (%) | 65.49 | 65.38 | 65.06 | 63.73 | 63.51 | |||||
| Weighted Accuracy (%) | 61.37 | 58.05 | 59.59 | 60.00 | 58.74 | |||||
| Time (s) | 367 | 148 | 3252 | 1108 | 581 |
Table: Accuracy of neural networks with 1 to 5 layers.
The table above shows the overall accuracy and time used to train the neural networks ranging from 1 layer to 5 layers. The training settings used can be found in The Details section. Weighted accuracy is computed by taking the average, over all the classes, of the fraction of correct predictions in this class (i.e. the number of correctly predicted instances in that class, divided by the total number of instances in that class). Unweighted accuracy is the fraction of instances predicted correctly (i.e. total correct predictions, divided by total instances). The distinction between these two measures is useful especially if there exist classes that are under-represented by the samples. Unweighted accuracy gives the same weight to each class, regardless of how many samples of that class the dataset contains. Weighted accuracy weighs each class according to the number of samples that belong to that class in the dataset. Time is the computational time, measured in seconds, required for both training and testing; a large proportion of this is attributed to training.
It is interesting to see that there is no clear performance gain from 1 layer to 5 layers; in fact, performance decreases when the number of layers exceeds 3. The time consumed to train the classifier does increase significantly as the number of layers (or the number of neurons) grows. For networks with more than one layer, pre-training is used for each layer to decrease the training time.
How about the layout of neurons in each layer? For example, how different is a neural network with a topology of 5 neurons in the first hidden layer and 25 neurons in a second layer, compared with a topology of 25 neurons in the first hidden layer and 5 neurons in a second layer? The table below shows that the change in performance is insignificant, but has a slight increase when the total number of neurons increases; unfortunately, this is not conclusive, as we only have one example in this specific experiment setting.
| 5, 25 | 25, 5 | 5, 5 | ||||
| Accuracy (%) | 65.30 | 65.38 | 63.57 | |||
| Weighted Accuracy (%) | 57.33 | 58.05 | 54.60 | |||
| Time(s) | 148 | 148 | 153 |
Table: Accuracy of neural networks with various neurons arrangement.
Now, let’s investigate how number of neurons in a fully connected neural network can impact performance. Similar to the case of increasing the number of layers, increasing the number of neurons has little impact on performance, but time consumed to train the classifier still increases.
| 5 | 25 | 125 | ||||
| Accuracy (%) | 65.49 | 65.28 | 65.29 | |||
| Weighted Accuracy (%) | 61.37 | 61.11 | 61.31 | |||
| Time(s) | 367 | 1127 | 6074 |
Table: Accuracy of neural networks with increasing number of neurons.
As we can see from these experiments, more is not always better. However, it is unclear how to tune those hyper-parameters; there are just too many combinations! Therefore, it is not a bad idea when one is considering using neural networks, to first try out the simplest possible topology before increasing its complexity.
There have been many advancements in neural networks since their conception in the 40s, especially at the turn of the century. With recent variations on recurrent neural networks, which focus on sequences of words in text, using these may be an experiment you’ll want to try!
Have you ever wondered:
- How text-based feature representations, such as uni-gram, bi-gram and tri-gram can impact performance in a classification task?
- Notice that the distribution of classes in this dataset, they are imbalanced. How would data distribution impact performance? Some classes are naturally similar to another, for example, happy and excited, simply because the way we express those feelings are more similar as compared to say, angry. How could confusion between classes arise?
- How much performance gain can we expect from a single neuron, compared to a fully connected neural network? See here
The Details:
Experiments settings:
Microsoft internal machine learning toolkit.
Experiments settings:
| Learner type | Neural Network | |
| Number of output nodes | 5 | |
| Loss function | Cross entropy | |
| Hidden layer | See table below | |
| Number of nodes for each hidden layer | See table below | |
| Maximum number of training iterations | 100 | |
| Optimization Algorithm | Stochastic gradient descent | |
| Learning rate | 0.001 | |
| Early stopping rule | Loss in generality (stops when the score degrades 5 times in a row) | |
| Pre-training | True for 2 or more hidden layers | |
| Pre-trainer type | Greedy | |
| Pre-training epoch | 25 |
Table: Experiment settings.
| Number of hidden layers | Number of neurons in each layer | |
| 1 | 5 | |
| 2 | 25, 5 | |
| 3 | 125, 25, 5 | |
| 4 | 5, 25, 125, 25 | |
| 5 | 5, 25, 125, 25, 5 |
Table: Topology of neural networks in this experiment.
Full results:
Full results can be found at https://github.com/ryubidragonfire/Emotion