We are happy to announce that Visual Studio 2022 version 17.12 is now generally available! This post summarizes the new features you can find in this release for C++. You can download Visual Studio 2022 from the Visual Studio downloads page or upgrade your existing installation by following the Update Visual Studio Learn page.
Standard Library and MSVC Compiler
As always, you can find all the details about our STL work in the changelog on GitHub. Thanks to everyone who contributed changes for this release!
On the conformance side, we have finished the implementation of C++23’s P2286R8 Formatting Ranges by implementing:
- Formatters for the container adaptors
stack,queue, andpriority_queue. #4825 - range-default-formatter. #4716
We implemented multidimensional subscript operators in the compiler, which supports our existing <mdspan> implementation. For example, you can use the my_mdspan[i,j] syntax to index multidimensional spans. Here’s a full example:
#include <mdspan>
#include <print>

using namespace std;
int main() {
    const char* const str{"CatDogElkFox"};
    //Defines a multidimensional view of str
    mdspan<const char, extents<int, 4, 3>> m{str, 4, 3};

    for (int i = 0; i < m.extents().extent(0); ++i) {
        for (int j = 0; j < m.extents().extent(1); ++j) {
            //Note the m[i, j] syntax
            print("m[{}, {}]: '{}'; ", i, j, m[i, j]);
        }
        println();
    }
}
This release also comes with some new C++26 features:
- P2997R1 Removing The Common Reference Requirement From The Indirectly Invocable Concepts
- P0952R2 A New Specification For
generate_canonical() - P2968R2 Make
std::ignoreA First-Class Object
You’ll find improvements to several debug visualizers, including those for mutex/recursive_mutex and move_iterator.
We added lifetimebound attributes to min, max, clamp, ranges::min, ranges::max, and ranges::clamp, allowing MSVC code analysis and Clang -Wdangling to detect dangling references in improper usage. See the documentation for warnings C26815 and C26816 for more information about lifetimebound annotations.
Finally, we improved the performance of several types and algorithms. The popcount() function now uses a compiler intrinsic on ARM64. We further improved the vectorized implementations of the minmax_element() and minmax() algorithm families, and optimized the search() and find_end() algorithms. We also overhauled the implementations of condition_variable and condition_variable_any, which has knock-on effects on the timed_mutex and recursive_timed_mutex types.
C++ Productivity
Set Command Line Arguments
For Unreal Engine projects, you can now set the command line arguments to pass to your application directly from the toolbar. This toolbar component will show up by default if you have the Game development with C++ workload installed. If you don’t see it, you can add it by right-clicking on the toolbar and selecting Set Arguments.
We’ll be adding support for this feature to non-UE projects in the future. See Pass command-line arguments while debugging on Microsoft Learn for documentation.
Open Folder for Unreal Engine uproject
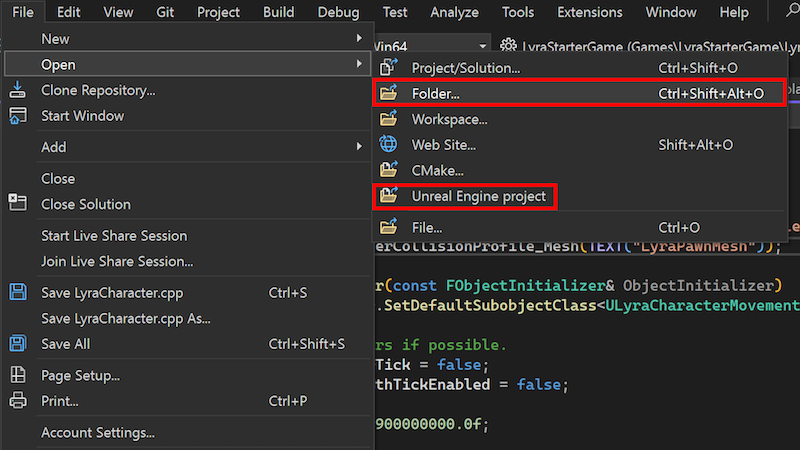
We have added an additional entry point to open your Unreal Engine uproject with Visual Studio’s uproject support. You can now open your uproject directly from the File menu by selecting Open > Folder…. This will open your Unreal Engine project in Visual Studio.
For more information on how to use this feature, see the documentation on Microsoft Learn and our announcement blog post.
Change Signature Improvements
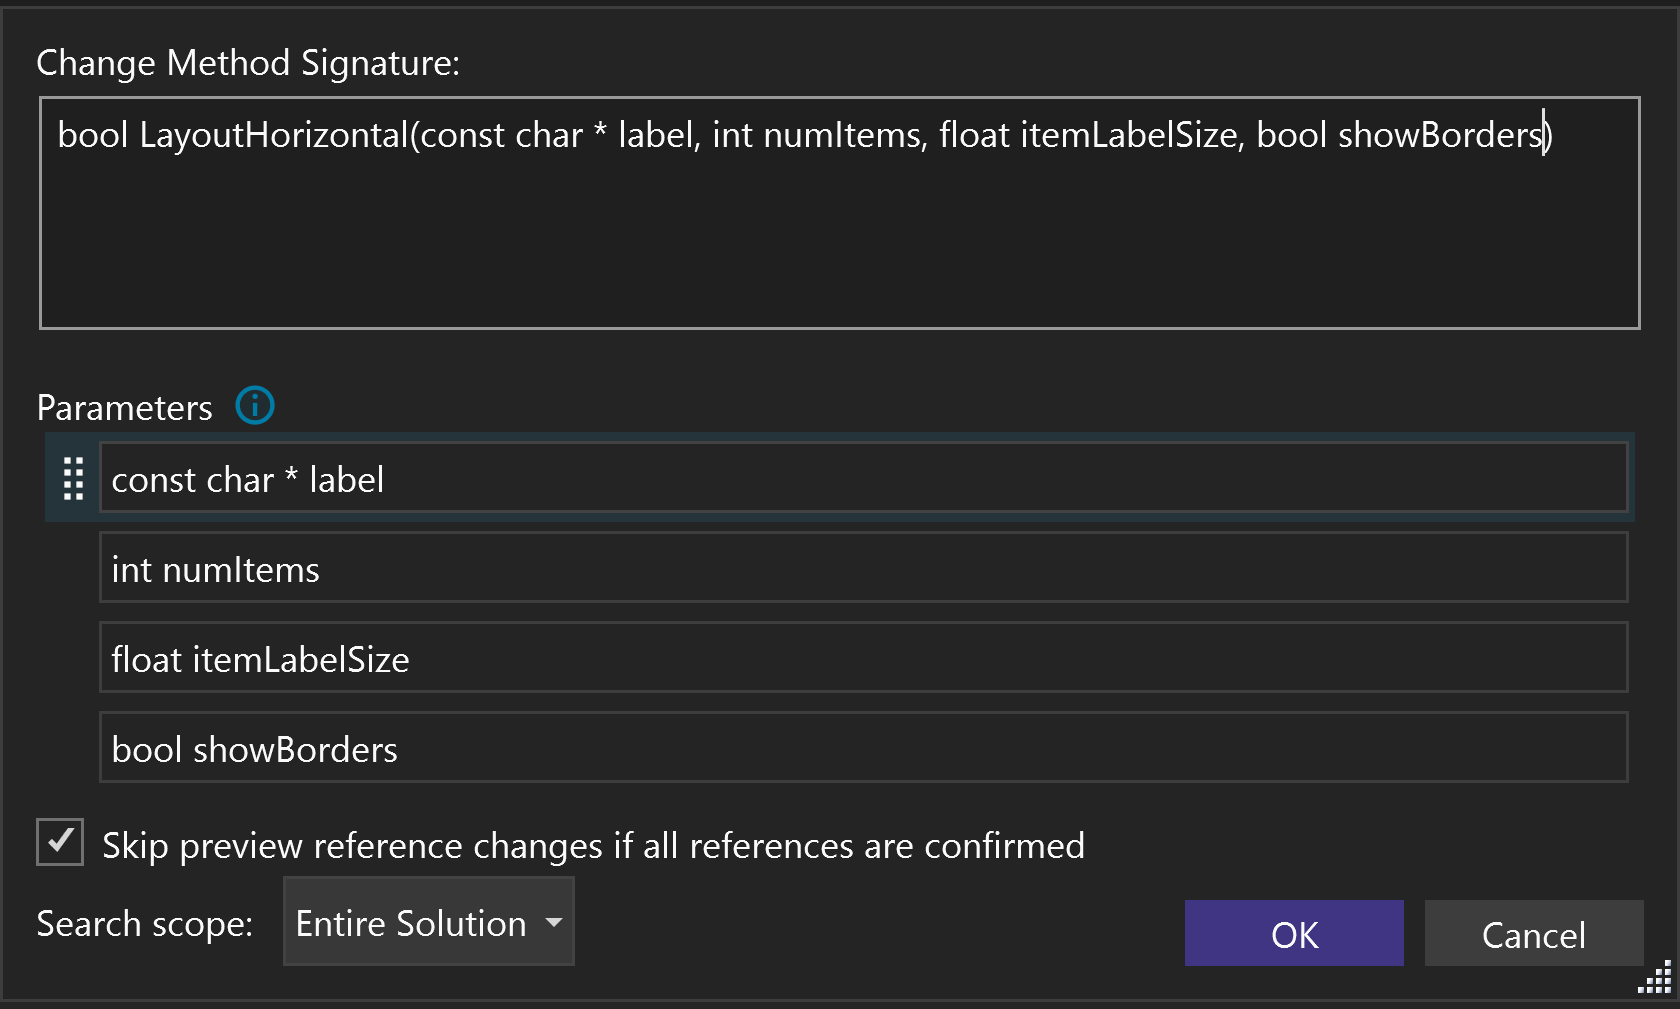
We have updated the Change Signature interface, allowing you to add, remove, and rearrange parameters in the parameter configuration section. Additionally, you can change their order by selecting and dragging them to a new position.
The access methods remain the same: press Ctrl+. to trigger the Quick Actions and Refactorings menu and select Change Signature.
Build Insights
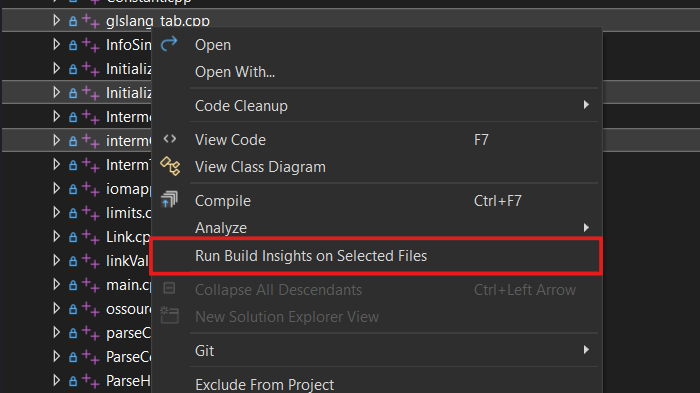
Run Build Insights on Selected Files
You can select a few files, run Build Insights on them, and see exactly how these files impact build performance.
Filter Projects
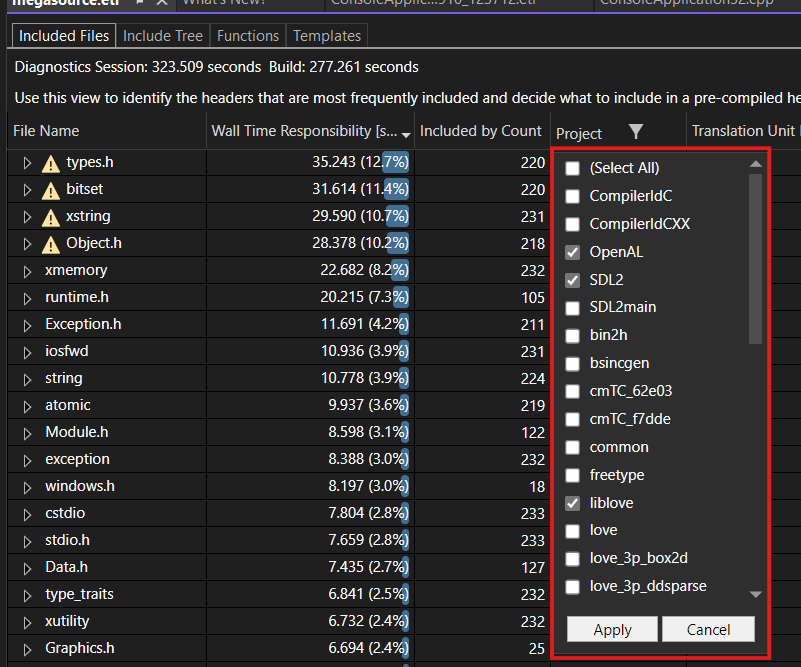
You can now filter results based on projects. Simply click the filter button on the filter column header and select the projects you want to filter.
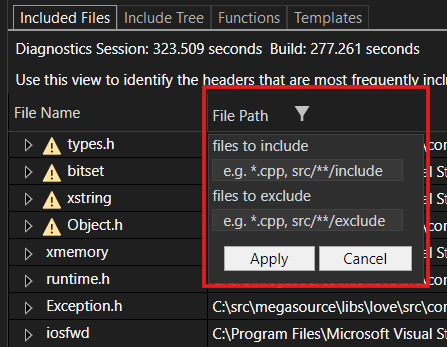
Glob Patterns to Filter Files
The File Path Filter is incredibly useful for narrowing down your analysis to specific directories or excluding paths that aren’t relevant to your task.
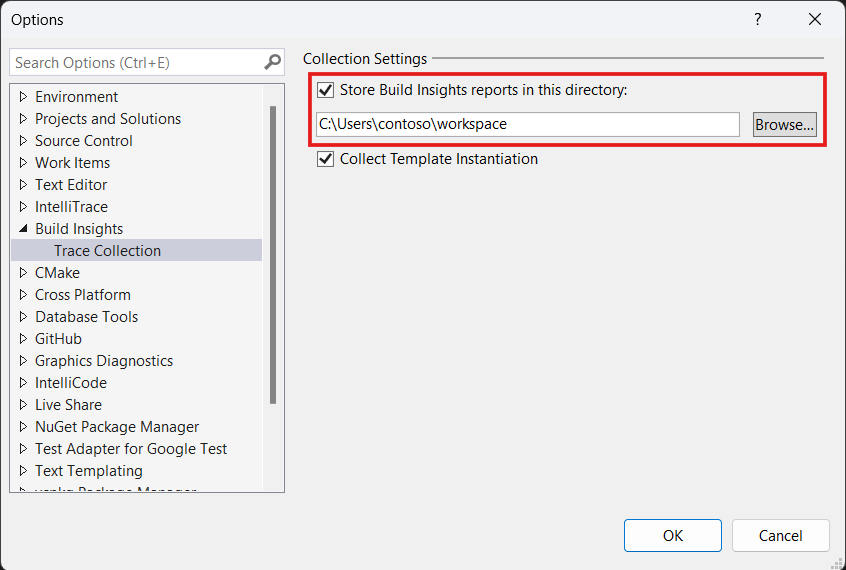
Enhanced Save Experience
Now you can designate a folder to automatically store the reports so you can easily access them during your investigation.
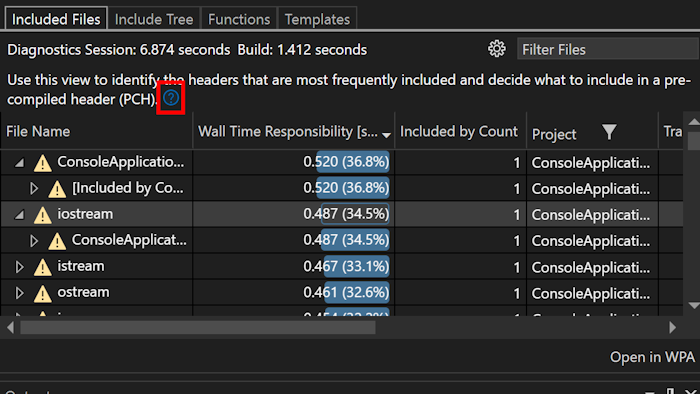
View Explanations
You can now see a short description on how each tab of Build Insights can be used, along with a link to the documentation for a detailed explanation.
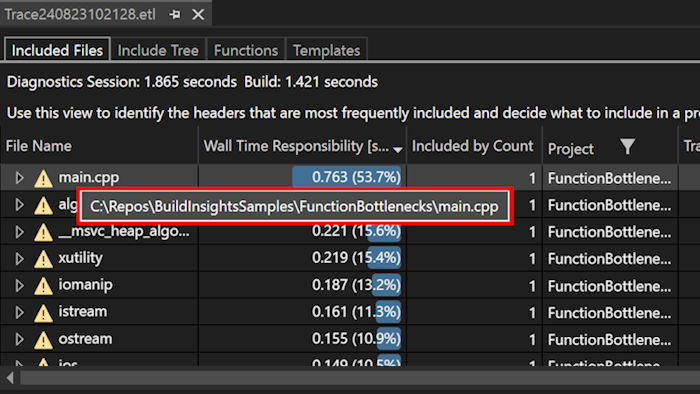
Path Adjustments
We have hidden full and relative paths to reduce clutter. To see full paths, simply hover over the file. You will also see a new File Name column for both files and translation units, displayed by default to help you quickly identify files without parsing lengthy paths.
General Productivity
Copy from the Error List
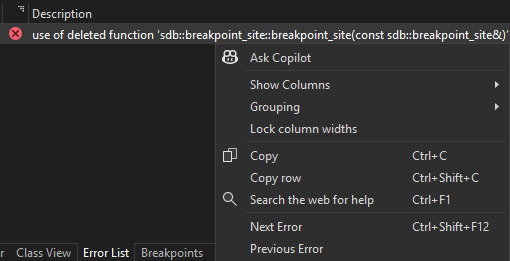
When you copy an error from the Error List using Ctrl+C, now only the description is copied to the clipboard. This makes it easier to search for the error online or share it with others.
You can still copy the entire row by right-clicking the error and selecting Copy Row from the context menu or hitting Ctrl+Shift+C.
If what you wanted to do with the error description was to do a web search, then just hit Ctrl+F1 to search for information about the error online.
Dock the Code Search window
If you need Code or Feature Search to stay out of your way, you now have more control over the behavior of the search window.
You can now dock the search window and perform tool window actions with it, like Solution Explorer and others.
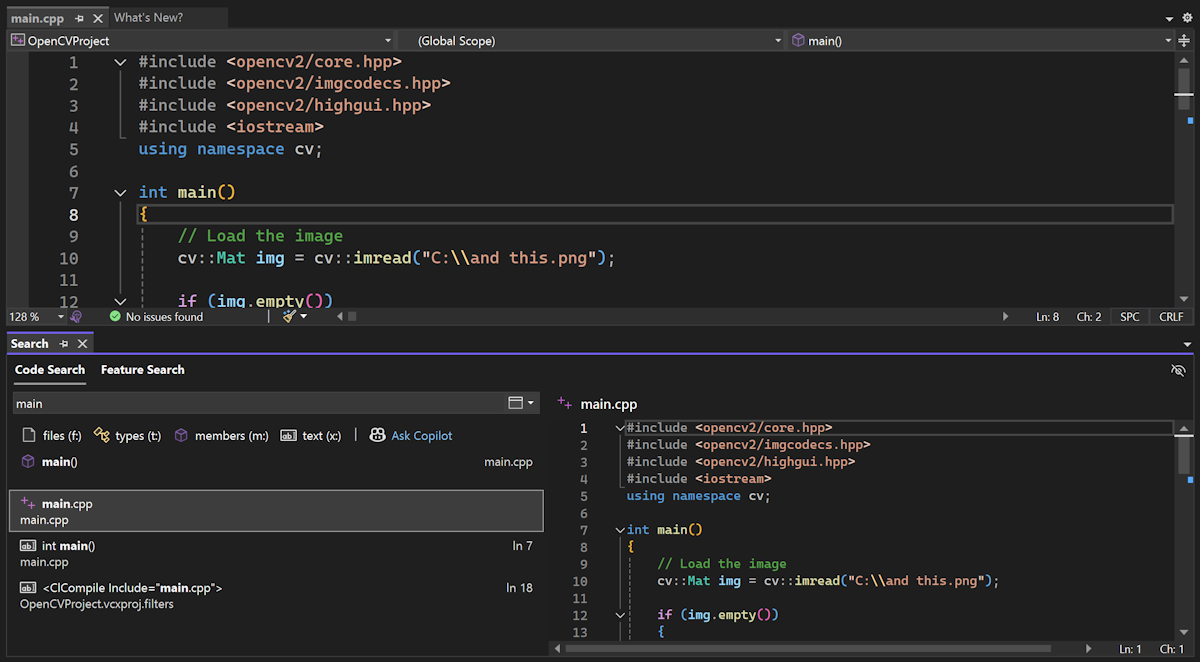
After opening Code Search or Feature Search, click on the box icon at the top right to convert it into a tool window. You may choose to dock it elsewhere, pop it out, auto-hide, etc. You can revert to the dismissible window by closing the tool window and reopening search.
![]()
We’ve also simplified and cleaned up the previewing experience in search. There is now one button, indicated with an eye icon, to toggle the preview on and off.
![]()
Refresh your Find results
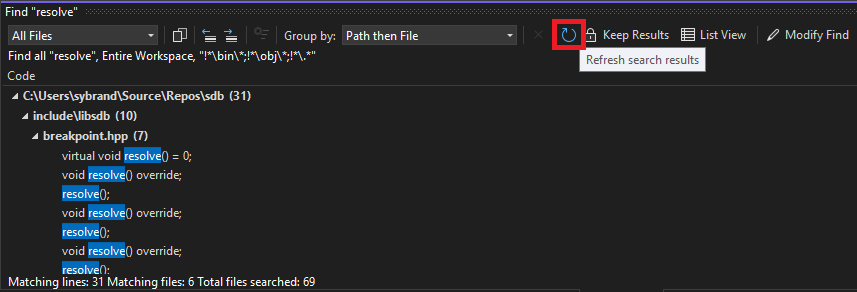
We heard from a lot of users that it’s frustrating having to reopen the Find window and go through the motions of redoing a search to get updated results. Maybe you just refactored some code and want to confirm everything has been changed as expected, or you pulled some recent changes and need your recent Find operation to reflect those updates.
After completing Find in Files, you will now have the option to refresh the results in the window. You’ll get your updated results without having to redo the search.
Non-blocking Code Cleanup on save
Previously when a Code Cleanup action was run on save, you couldn’t perform any actions in the IDE. We’ve now enhanced this to operate in a non-blocking manner. The cleanup process will run in the background and can be automatically cancelled if you resume typing.
Git
Manage file renaming
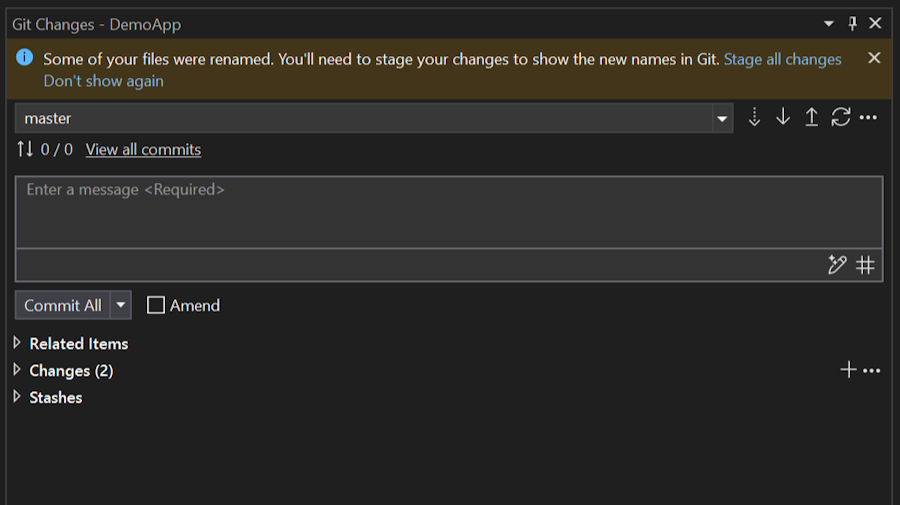
When you rename files from the Solution Explorer, you’ll now be reminded to stage your changes to see the renames in Git.
Copy Git link
You can now get a GitHub or Azure DevOps link to a specific line of code to make it easy to share with your colleagues. Access this option by right-clicking on some code and selecting Git > Copy GitHub/Azure DevOps Permalink.

Debugging
Inline Return Values
The debugger now displays return values inline, making it much easier to see the return value of functions that have complex return statements.

GitHub Copilot
Smart Variable Inspection
You can now click on Ask Copilot next to the value of a variable to get AI-driven insights into what led to your current program state. For example, the following program has an off-by-one error in its loop condition, resulting in undefined behavior:
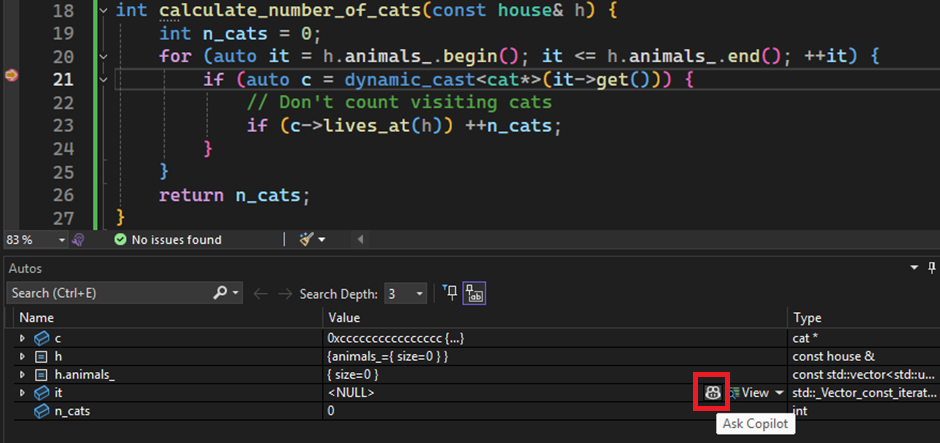
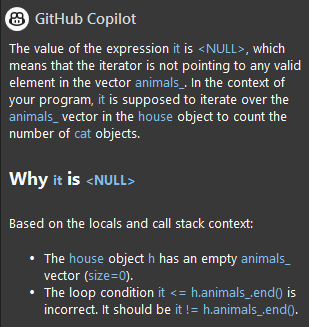
If you click Ask Copilot, it tells you what went wrong:
Fix my Code
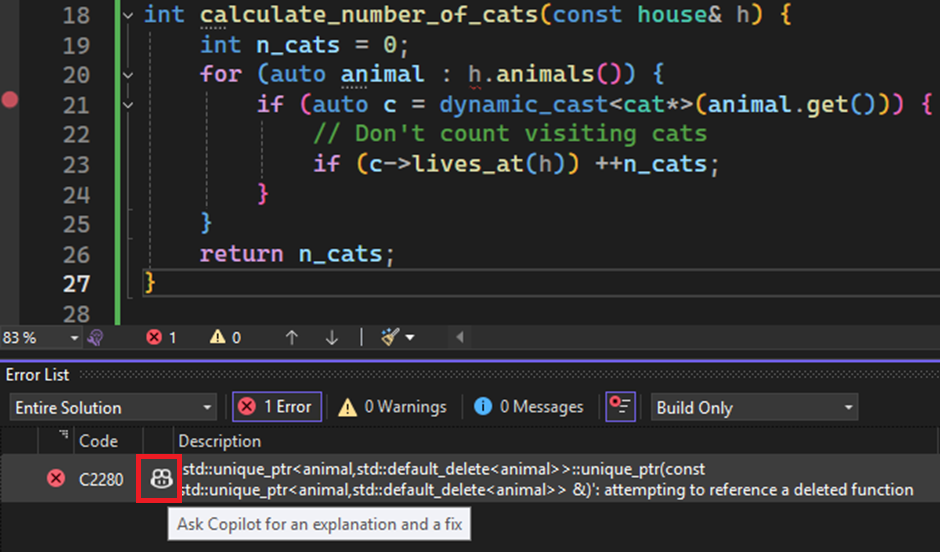
For errors in the Visual Studio Error List, you can click Ask Copilot for an explanation and a fix to get suggestions on how to rectify your errors. For example, if we try to fix the code from the previous section by introducing a range based for loop, we might get the following error:
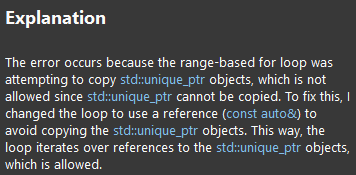
Copilot suggests the following:
Debug Failed Tests
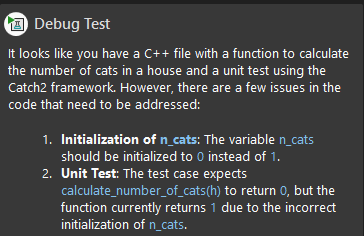
We might fix the above issue and write a test case to ensure the function works, but then have a cat sit on our keyboard and accidentally initialize n_cats to 1 instead of 0. Fortunately, GitHub Copilot now comes with options to help debug the test failure:

Selecting this option may give something like the following:
Send us your feedback
We are very much interested in your feedback to continue to improve this experience. The comments below are open. Feedback can also be shared through Visual Studio Developer Community. You can also reach us on Twitter (@VisualC), or via email at visualcpp@microsoft.com.


We recently got 17.12 but now source code is littered with Intellisense errors of various sorts. The cpp builds without any errors. In my recollection this wasn’t the case with 17.11.4. I have already tried a full rebuild but no effect. Upgrade to 17.12.1 didn’t help either.
nice feature to see the function return value
Build Insights unlocks soooo much value when it comes to reducing product iteration time. Massive thank you to all involved.
Been in software for 20+ years professionally, so I’ve seen some… stuff. But I can’t fathom the things that must have manifested in the codebase where it was, somehow, only possible to enable the “Set command line arguments” for UE projects and not generally…
We are sorry for the inconvenience, the Set Command Line Arguments feature is initially available for the Unreal Engine because it was designed as a partial replacement for the UnrealVS extension. We are aware that it is a feature that could benefit all C++ developers and we are working to make it available for everyone.Read more
You can already use the feature if you install Visual Studio Tools for Unreal Engine, the package does not activate anything else if you don't load an UE project so you can use the feature at the expense of about 70 MBs of disk space.