
As mentioned in this blog post a few weeks ago, one of the features we’re adding in Visual Studio 2013 Update 2 (Download Update 2 RC) is Graphics Frame Analysis. This feature can be useful to help identify performance bottlenecks in your DirectX applications.
How to use it?
To start, launch your DirectX app with Graphics Diagnostics through menu DEBUG->Graphics->Start Diagnostics or use shortcut “Alt+F5“. Once the app is running, you can capture frames from the app by pressing “PrintScreen” key in the app or using the capture button in the Graphics Toolbar in VS (see red circle in the screenshot below)
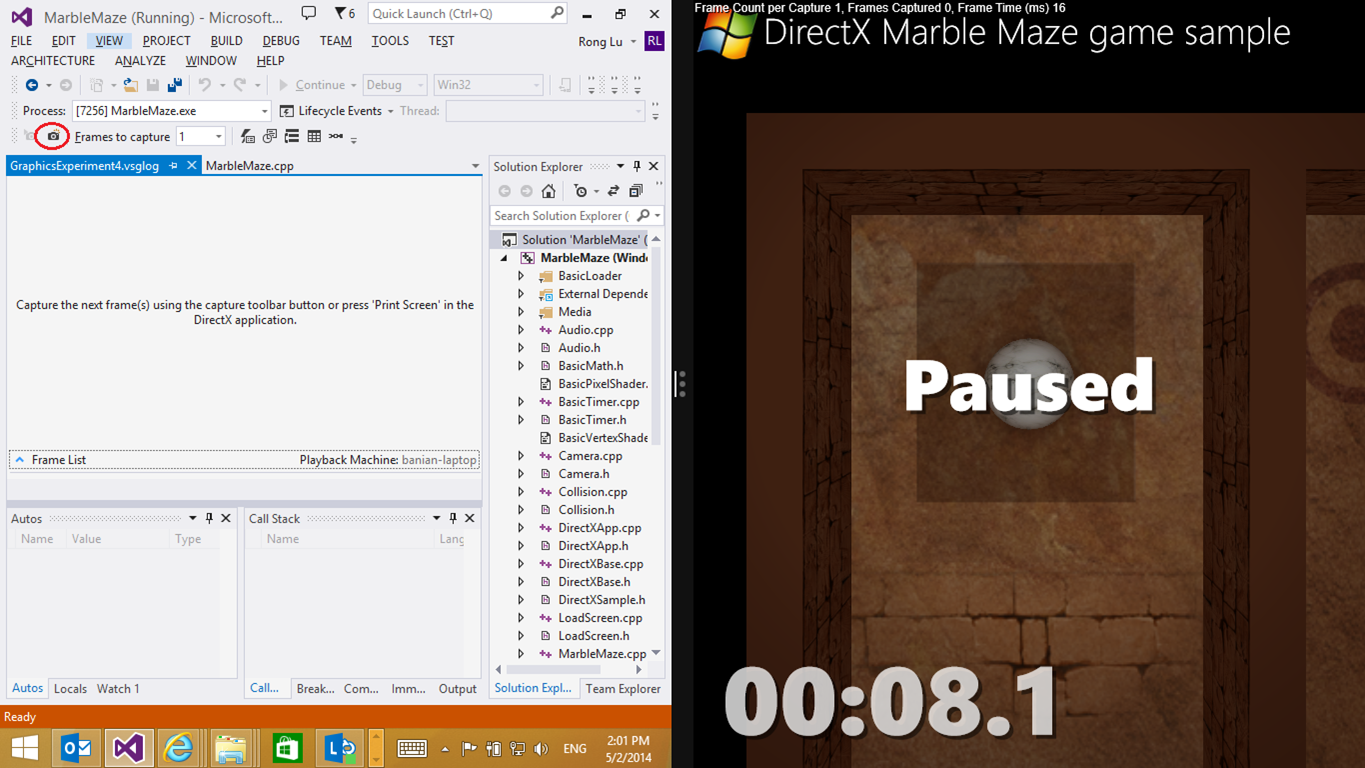
Switch back to VS, you should be able to see a frame captured in Frame List. At this point, you can continue to capture more frames, or start analyzing the frame in VS while the app is still running, or stop debugging and analyze the frame in VS. Use the Graphics toolbar to bring up various tool windows to inspect events, objects, pipeline stages, pixel history and call stack to diagnose rendering issues. I’m not going to go into details about how to use the feature to identify rendering problems in this blog post because we’re going to focus on Frame Analysis today. But if you are interested, we have document on MSDN to walk you through the feature.
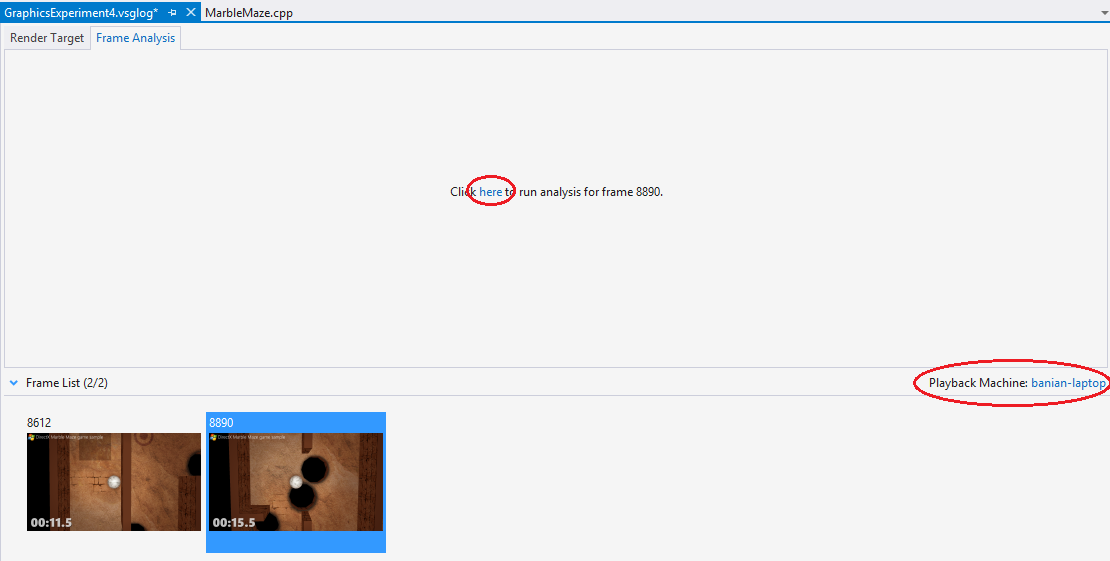
Now onto Frame Analysis! To generate an analysis report for captured frame, switch to the Frame Analysis tab in the vsglog document. (see red circle in the screenshot below)
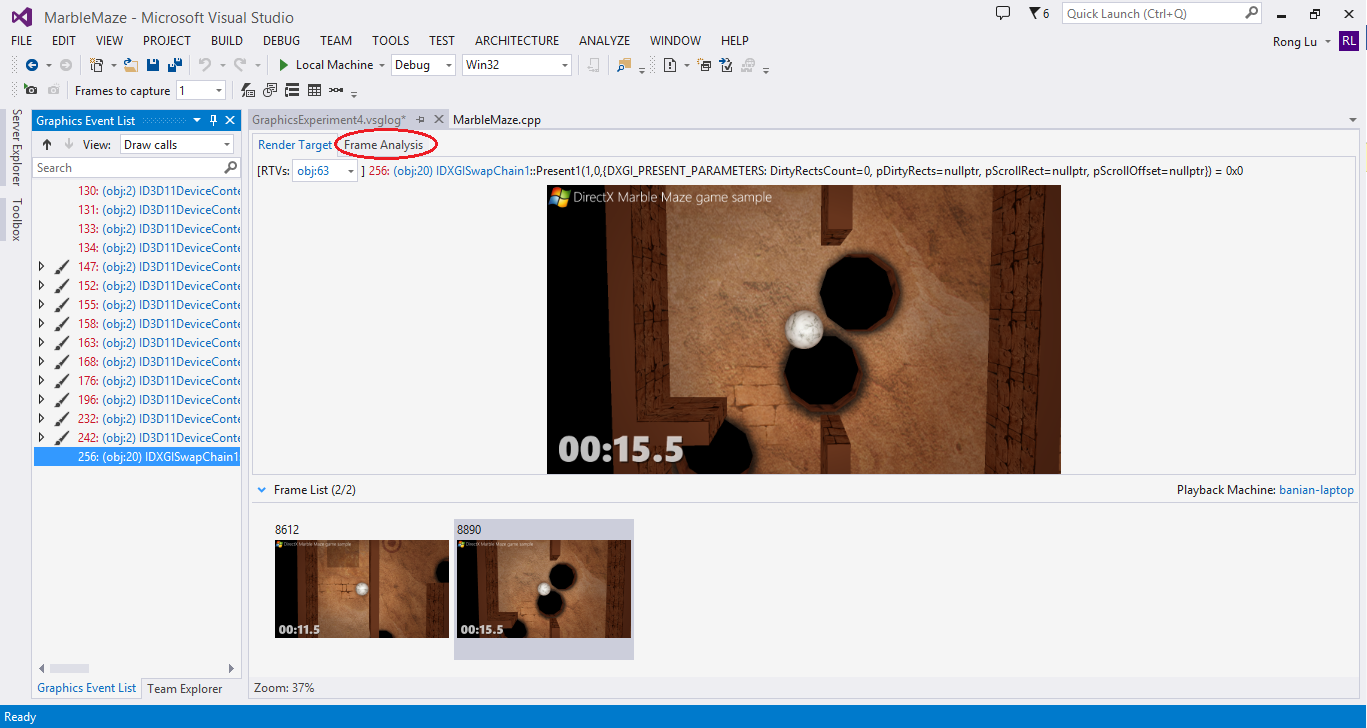
Then click the link in the document to start analysis. The analysis will collect GPU timing for each DirectX draw call and GPU performance counters if running on Windows Phone 8.1 devices, and it will perform a set of pre-defined experiments that provides insights into how different techniques can impact the performance of your app. Since the data is collected from GPU, the results can vary on different hardware. You can change Playback Machine (to a remote machine, or a tablet, or a Phone) for the analysis to perform on the specific hardware you want to optimize for.
How to read the report?
Once analysis is finished, a report will be presented inside VS. MSDN document explains how to interpret the data in the report. Or read Shawn Hargreaves’s blog post in which he talks about how to read the data. Or go watch the Channel9 video nicely done by Adrian Tsai, in which Adrian walked through the features in greater details with a really cool sample project.

When can I use it?
Graphics Frame Analysis feature supports Windows apps, desktop apps and Windows Phone apps that run on Windows Phone 8.1 device (Window Phone 8.0 devices don’t have the necessary driver support for this feature).
Download Visual Studio 2013 Update 2 RC, try it out and let us know what you think. J
0 comments