In Visual Studio 2008 we introduced a useful, but not very well known, feature in the Native Debugger for visualizing enum bit flags. Consider the following code:
enum x {
bit_none = 0,
bit1 = 1,
bit2 = (1 << 1),
bit3 = (1 << 2),
bit4 = (1 << 3),
bit_all = -1
};
Let’s define a variable:
x flags = static_cast<x>( bit1 | bit2 | bit4 );
In Visual Studio 2005, the Debugger shows the following in a Locals Windows:
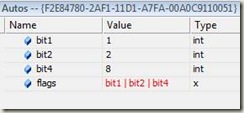
But Visual Studio 2008 is better than that. Instead, you’ll get this:
which is more intuitive and readable as we see field names instead of integer values.
This feature was specifically designed to visualize bit flag names that are a power of two. As soon as an enum contains members whose values don’t adhere to this requirement, the visualization won’t work since arbitrary numeric values (i.e. those not a power of 2) cannot be interpreted by the debugger in a single way. This rule has two exceptions: we support a value of 0, which indicates no bits set, and a value with all bits set for the underlying type. In the case of int this value is -1 (yes, it is platform specific J).
The Debugger is the single most used feature of Visual Studio. We are well aware of that and are committed to constant improvements in this area. We are always interested in hearing your ideas for what you’d like to see in the next version of the Visual C++ Debugger. Let us know if you have any interesting requests!
Thanks,
Vytautas Leonavičius/Visual C++


0 comments