

Introduction
Introducing the new Templates View feature of Build Insights! Templates View now allows you to capture data about how templates in your codebase are contributing to your build time. This feature is available in Visual Studio 2022 17.10 and later.
Getting Started with Templates View
To use Build Insights in Visual Studio you will need to ensure you’ve installed the “C++ Build Insights” component. This is installed by default if you’ve installed either the “Desktop development with C++” or “Game development with C++” workloads.
By default, Templates View is turned off; To turn on Templates View navigate to the Tools menu and select Options…
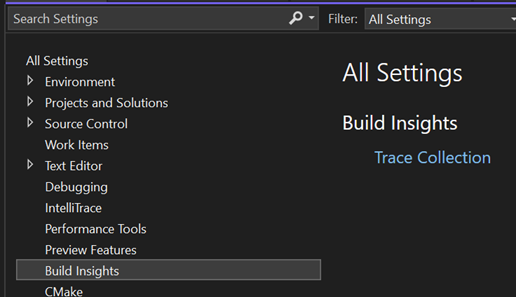
Select Build Insights in the list of options and click Trace Collection. This will show the available settings for Build Insights.
In the popup options menu, select the checkbox for Template Instantiation Collection; this will turn on Templates View.
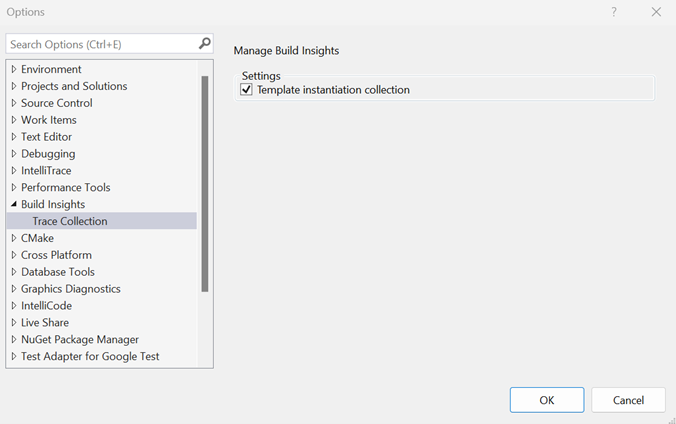
With the checkbox selected, you can run Build Insights on your project. This action will collect the template data and display it. If you have a trace file from a previous run where the template data was collected, you can open this trace file to view the “Templates View” in the report.
Please note that if you have a trace file that was run without this checkbox turned on, the template data was not collected in that trace file and thus no data will appear in the Templates View. You will need to rerun Build Insights with Templates View turned on if you’d like to see the template data for that project.
Using Templates View
Templates View highlights the impact of the template instantiations that take the most time in your build. The view only shows instantiations whose contribution exceeds a certain threshold. If you see nothing in the Templates View, it means your build time is not dominated by template instantiations.
Let’s walk through an example together of how to use Templates View. In a new C++ Console Application project, add a header file called Templates.h with the following code snippet:
#pragma once
#include <utility>
#include <vector>

template<size_t> struct S1 {};
template<int n> using type = std::vector<S1<n>>;

template<size_t...> struct S2 {};

template<typename> struct S3 {};
template<size_t... n>
struct S3<std::index_sequence<n...>> {
    using type = S2<sizeof(type<n>)...>;
};

inline size_t LargeValue() {
    return sizeof(S3<std::make_index_sequence<1000>>);
};

inline size_t SmallValue() {
    return sizeof(S1<5>);
}
Then create a source file called LargeValue.cpp with the following code:
#include "Templates.h"
size_t GetLargeValue() {
    return LargeValue();
}
Lastly, create a second source file called SmallValue.cpp with the below code:
#include "Templates.h"
size_t GetSmallValue() {
    return SmallValue();
}
We’ll now run Build Insights on a rebuild of our project to get information about our build time. 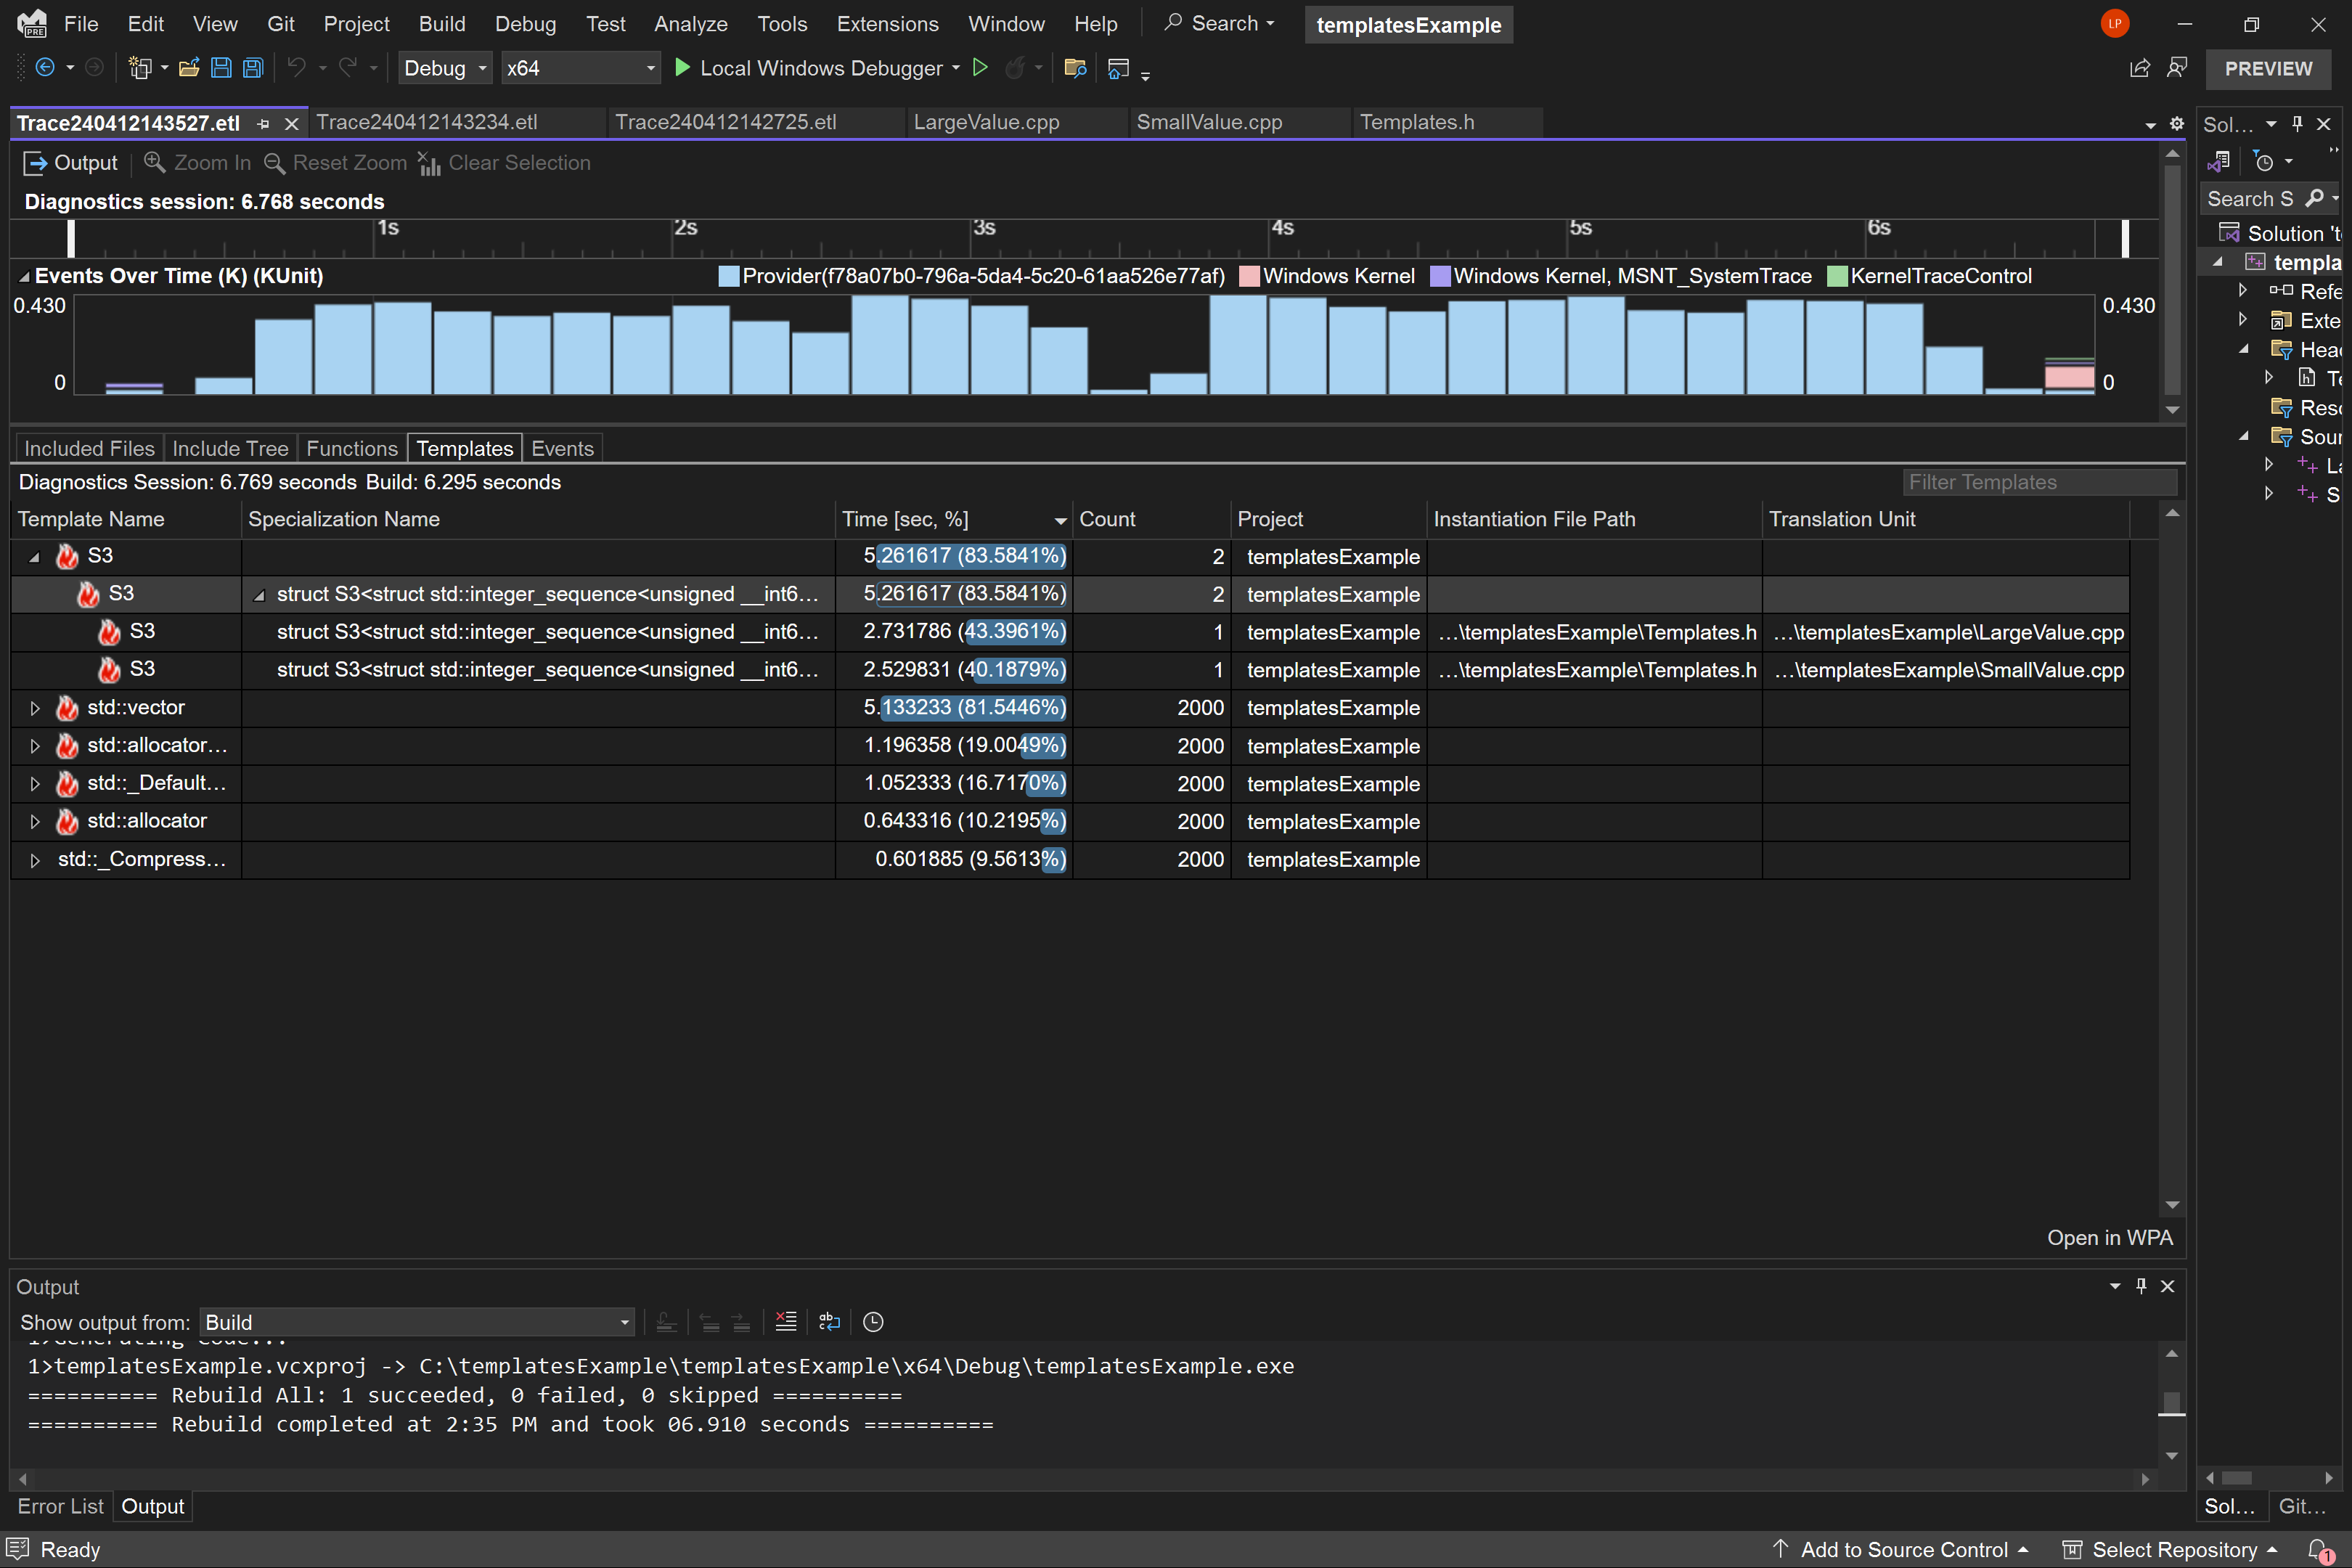
From the Templates View of Build Insights, we can see that two template instantiations of S3 are taking 83% of the entire build time. The “Translation Unit” column shows that both SmallValue.cpp and LargeValue.cpp are causing this template instantiation to be included in the build. The “Instantiation File Path” shows us where the template instantiation happens. We can derive that there’s one expensive template instantiation affecting both of our source files, because the “Instantiation File Path” and the “Specialization Name” are the same. This also explains why the time of each of the two template instantiations are about equal. Essentially, by including Templates.h in both of our source files, we are causing one template instantiation to add almost 6 seconds to our build time.
Let’s investigate further to find where this template instantiation is located. We know that the instantiation is created in Templates.h and we can use the “Specialization Name” column to determine that the below code is the culprit:
inline size_t LargeValue() {
    return sizeof(S3<std::make_index_sequence<1000>>);
};
There are three main ways to decrease the cost of template instantiations. The first way is to review the template in question and determine if it’s being used or not. If it’s not being used, then the easiest solution is to remove the function. In our program,LargeValue()is being used by LargeValue.cpp, so we cannot remove it. We can also consider removing the include directive(s) that is bringing in this template instantiation. It’s easy to forget to remove header files when you’re no longer using them, and this is a great demonstration of how an include directive can cause a huge impact on build time. However, both of our source files are dependent on Templates.h so this will not help us.
 Read #include cleanup in Visual Studio – C++ Team Blog (microsoft.com) for more information on decreasing template instantiation cost by removing include directives.
The second way is to look at the template instantiation and determine if there is a way to optimize the code. The only optimization possible here is decreasing the size of the index sequence. As a fun exercise, try replacing 1000 with various numbers and see how that impacts the build time.
Read Build Throughput Series: More Efficient Template Metaprogramming – C++ Team Blog (microsoft.com) for more practice reducing the cost of template metaprogramming.
For our purposes, let’s assume that we need an index sequence of 1000. We now need to rely on the third way to decrease template instantiation cost: moving the definition of LargeValue() to a source file.
 Tip: If for some reason you need to keep the function in a header file, then you can move the definition to a .inl file. If you move the definition to a .inl file, then ensure the source files which use that function include both the header file and the .inl file.
LargeValue.cpp is the only source file that calls LargeValue(), so we can move the definition to LargeValue.cpp. To do this, remove the current definition of LargeValue() from Templates.h and replace it with the following declaration:
inline size_t LargeValue();
Then, inside LargeValue.cpp add the following code snippet:
inline size_t LargeValue() {
    return sizeof(S3<std::make_index_sequence<1000>>);
}
If we rerun Build Insights on a rebuild of the project we can now see the below Templates View: 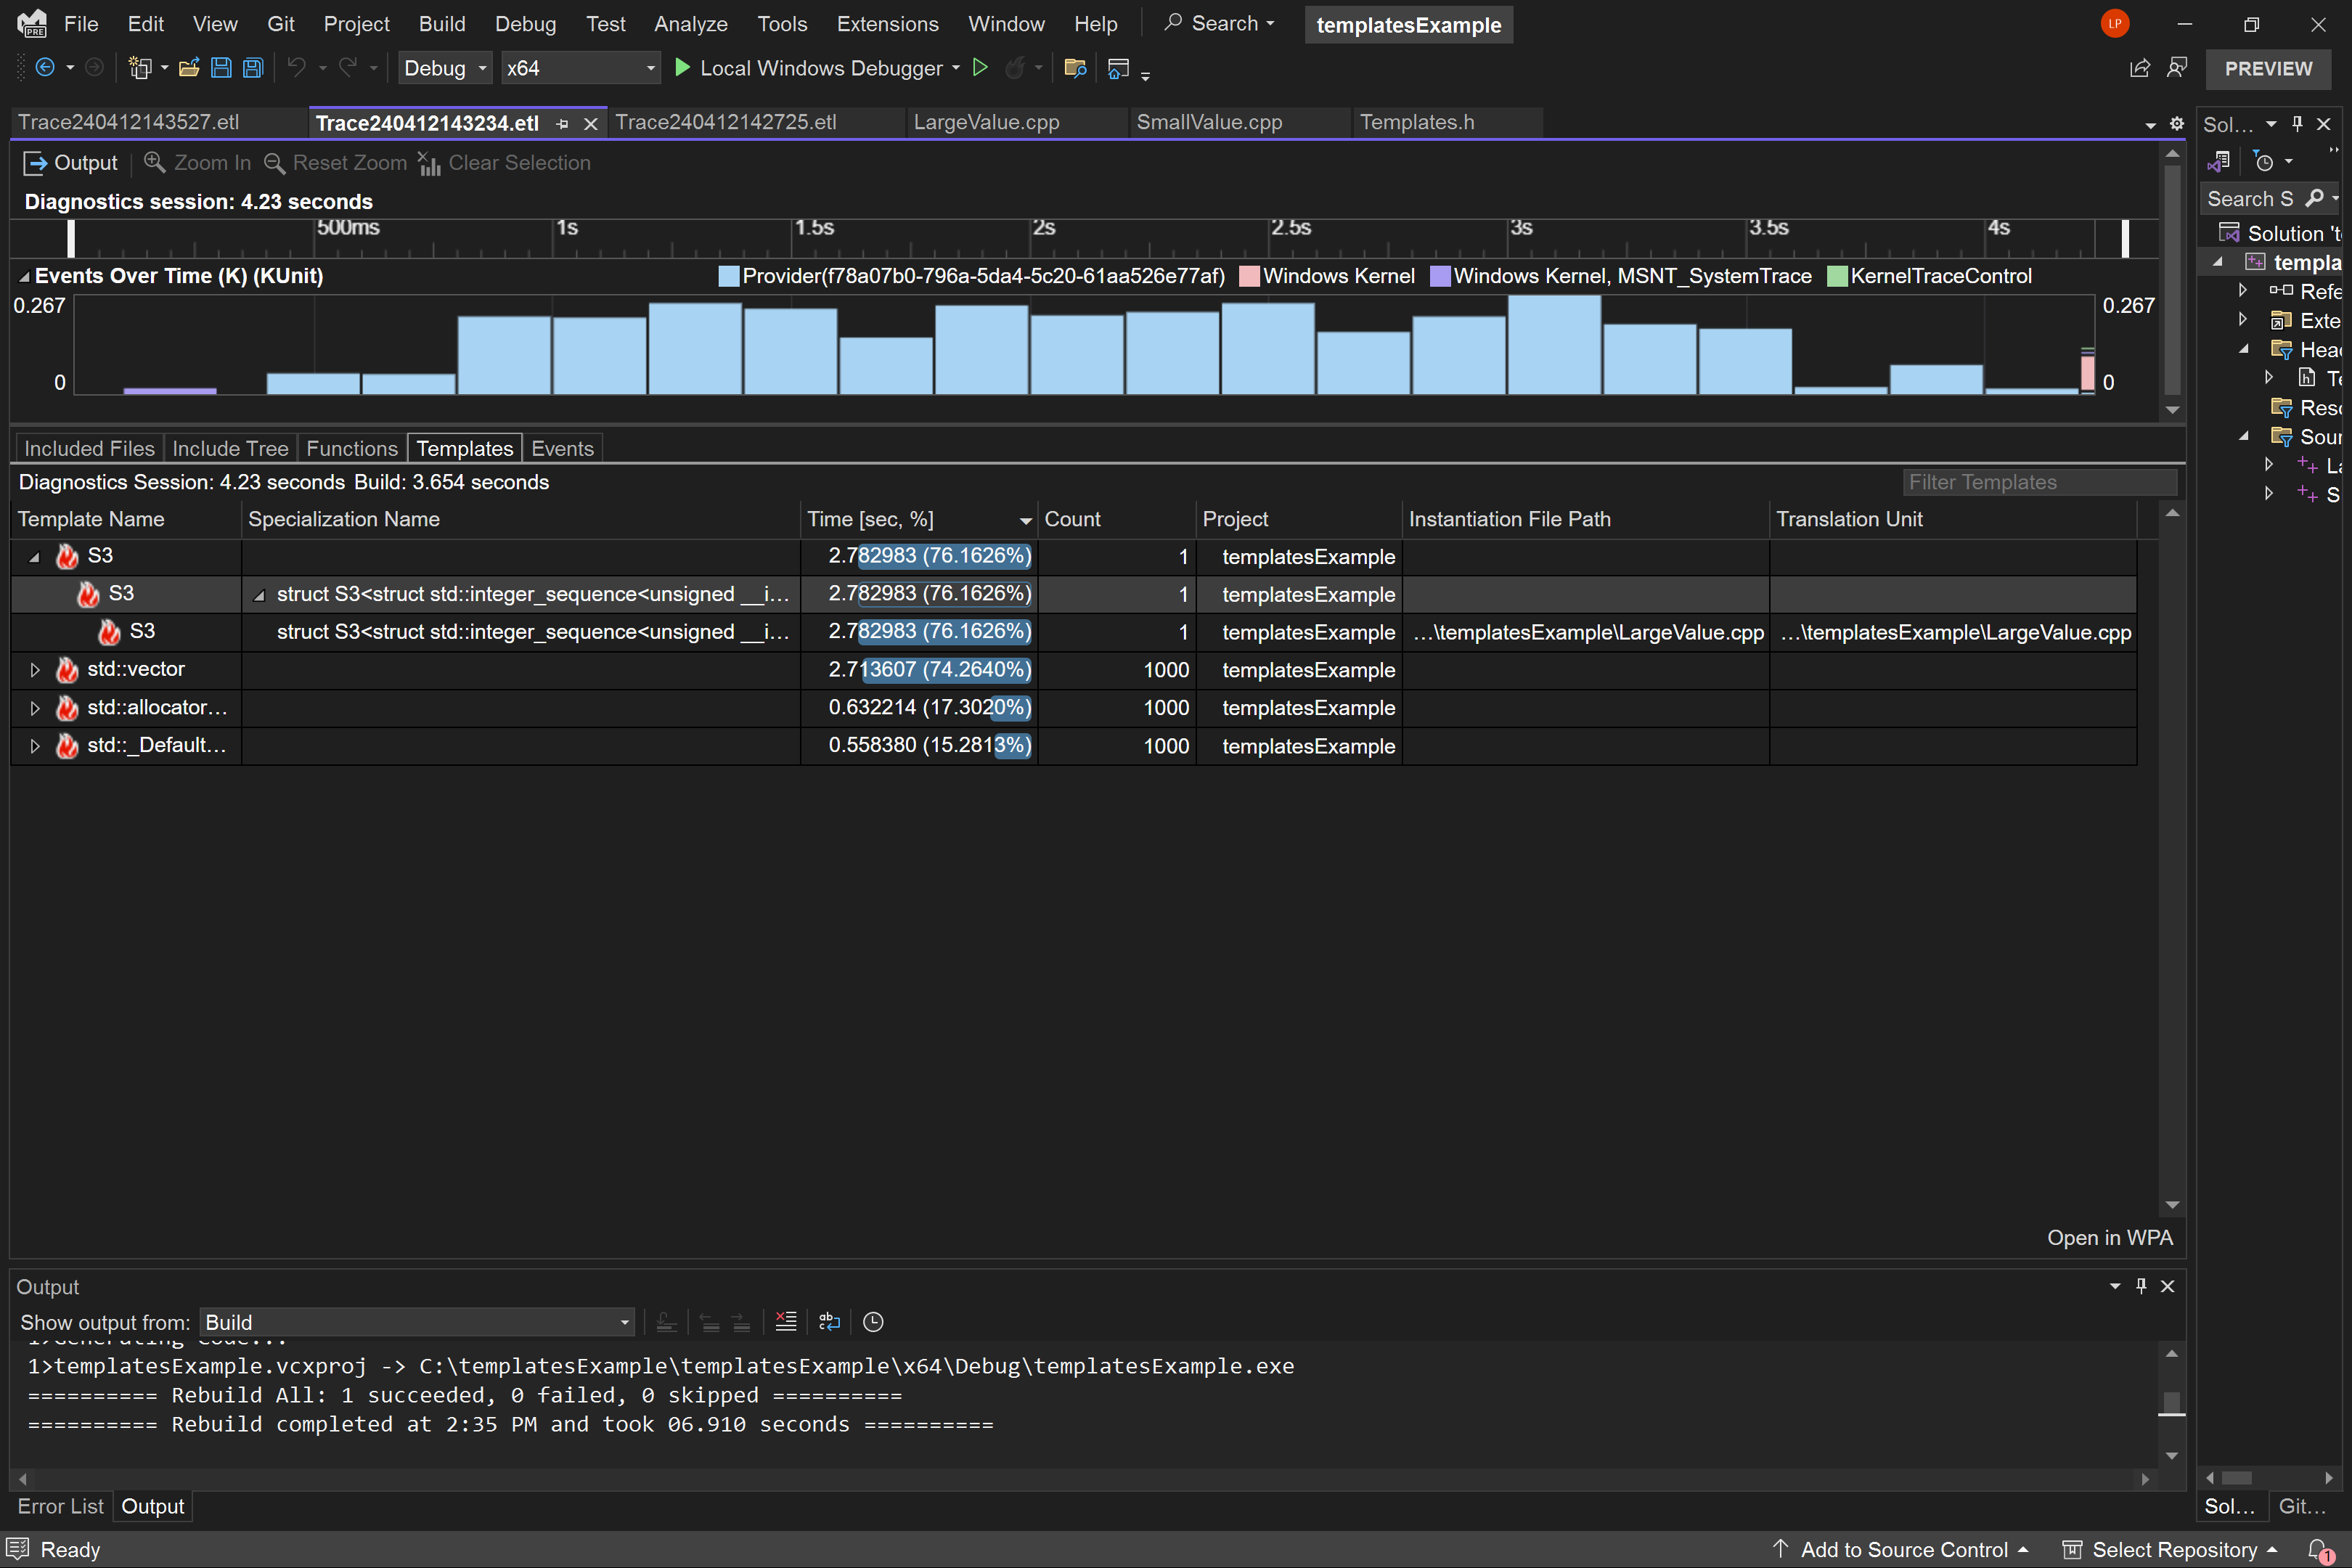
The build time has significantly decreased. While the template instantiation of S3 is still contributing 76% of the build time, we’ve been able to about half the total time, by only including necessary template instantiations (you can see the count of S3 is now 1).
The techniques used in this example can be applied to larger projects. If multiple files included Templates.h, each of those files would have added the instantiation time of LargeValue() to the total build time. By moving the definition of LargeValue() to a dedicated source file, we can minimize our build time.
 Try For Yourself: Create two more source files in the same C++ console application project we’ve been using above (you should now have four source files in your project). Have all files include the original
 Templates.h (before our optimizations). Run build insights on the project. Now apply the optimizations from the previous example above and ensure only LargeValue.cpp has the definition of LargeValue(). You should see the build time is decreased by 75%.
Costs Associated with Templates View
To collect the template instantiation information from your build, Build Insights utilizes a higher level of data collection than necessary for the other views in Build Insights. It also must perform additional post processing on the data collected. These two factors increase how long it takes Build Insights to generate a report; larger C++ projects will notice this difference more than smaller projects. Due to this increase in time, Templates View is turned off by default.
Thank You!
Thank you to Xiang Fan for adding ETW events to the MSVC compiler so we can track template data. Thank you to Kevin Cadieux for integrating the template ETW events into the Build Insights trace collection. Thank you to Nelson Troncoso for leading the development and design of Build Insights in Visual Studio. Thank you to our former C++ intern and my mentee Hanah Chandley, for her help on adding the Templates View into Visual Studio. Thank you to our developer community, especially our game studio partners, for their suggestions. We are constantly striving to improve Build Insights for Visual Studio and your comments and suggestions help us to do this. If you’d like to share your ideas or experience with us you can comment below, find us on Twitter (@VisualC) or email us at visualcpp@microsoft.com. To open a bug, please see Visual Studio Feedback.
Check out our previous blog posts about Build Insights for Visual Studio:
Build Insights Now Available in Visual Studio 2022 – C++ Team Blog (microsoft.com)
Functions View for Build Insights in Visual Studio 2022 17.8 – C++ Team Blog (microsoft.com)
Thanks for adding this. It would be good though to have some more in-depth explanation of the details and how to interpret them in a realistic scenario, where there won't be a single absurdly large instantiation jumping out. About all I can really say from looking at my traces from some very slow compiles, is that std::views appear to be a disaster for compile times.
The timings appear to add up to more than the compilation time (even on a single TU build), suggesting these numbers are inclusive of nested instantiations? Could we get both inclusive and exclusive? Also I'm...
Thank you for your feedback. You've highlighted several crucial areas for improvement. I've created a feedback ticket for each of your points to increase visibility and track these updates.
Regarding your first point, we are are working hard on making the data easier to understand, we have improvements on the backlog regarding this. Our goal is to save you from navigating through the sea of data and provide you with the relevant information. Ticket: https://developercommunity.visualstudio.com/t/Make-it-Easier-to-Understand-Data/10660453
Regarding the timings, we currently use the wall clock time as a metric, which offers a direct view of how builds are affected. This metric...
Thanks for the response, and for creating the tickets. Much appreciated.
Totally understand there are a bunch of trade-offs to make with the metrics and presentation, it’s far from easy to find a good balance. Too much data and it quickly becomes useless from a practical point of view.