

Last year, we launched our new GitHub Copilot build performance capabilities in Private Preview. With help from our fantastic C++ community, we gathered insights and addressed key feedback. We’re happy to share that GitHub Copilot build performance for Windows is now in Public Preview. Today, all C++ developers can try out the new capabilities in the latest Visual Studio 2026 Insiders.
“I’ve tried the feature for a few hours and I’m happily impressed. The agent provided accurate suggestions, implemented them, and managed to reduce my build time by about 20%.” – Alessandro Vergani, ARGO Vision
Optimizing Build Times with GitHub Copilot
When you use this new capability in Visual Studio, GitHub Copilot will use an agent to:
- Initiate a build and capture a diagnostic trace
- Identify bottlenecks in the following areas:
- expensive headers
- long function generation times
- costly template instantiations
- Suggest and apply optimizations
- Validate changes through rebuilds so your code stays correct
- Report measurable improvements and recommend next steps
To see how it works in action, please watch our demo below.

Learn more: Documentation for GitHub Copilot build performance for Windows | Microsoft Learn
Using GitHub Copilot build performance for Windows
There are several ways to start the new build performance capabilities:
1. Select the responder in Copilot Chat by typing “@BuildPerfCpp”
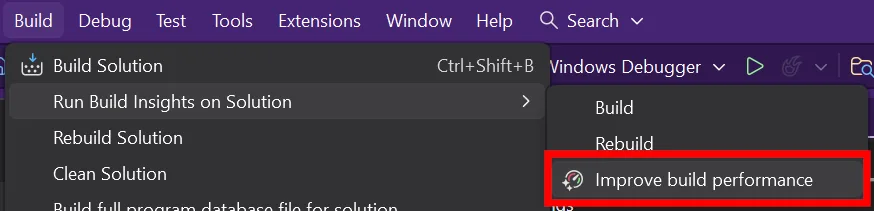
2. Select menu entry Build > Run Build Insights > Improve build performance
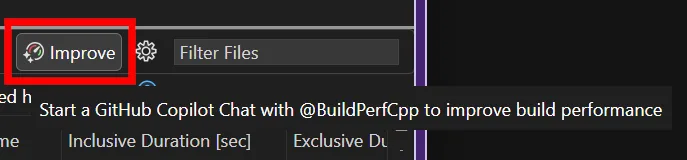
3. If you already have a .etl trace file open from Build Insights, click Improve on the top right corner of the report view. The view or tab you click from gives GitHub Copilot important context to focus on the relevant hot spots when the chat session begins.
Once you start a chat session from any of the entry points above, GitHub Copilot begins analyzing your build and offering suggestions to reduce build time. It will iterate on these optimizations until your build completes successfully. You’ll always have final approval on whether to apply the changes.
Using The Build Insights Tool
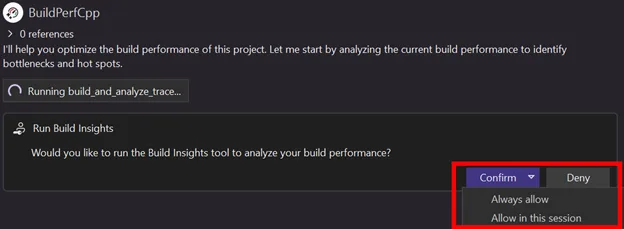
To start trace collection, GitHub Copilot will ask your permission to run the Build Insights tool.
If it is your first time using Build Insights, you will need to grant a one-time elevated request.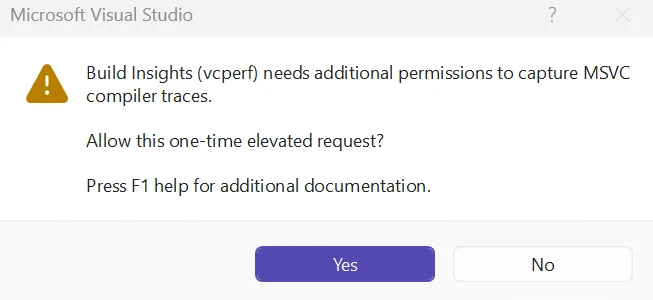
Learn more: Build Insights needs additional permissions | Microsoft Learn
Template Instantiation Collection
To collect template information, you must opt-in via Tools > Options > Build Insights > Trace Collection > Collect template instantiation.
Default Report Location
By default, your reports will be saved in %TEMP%/BuildInsights. You can customize the save location at Tools > Options > Build Insights > Trace Collection > Override default location for saved reports.
Share your feedback
We’d love to hear feedback on how we can improve GitHub Copilot build performance for Windows. Please leave feedback by commenting below or report any issues with Help > Send Feedback.
0 comments