Debugging C++ code on iOS with Visual Studio 2015
Following up on our previous announcement that Visual Studio added support for debugging C++ on Android we are excited to announce that we now support debugging C++ on iOS as well. Before continuing I would recommend reading the Visual Studio C++ support for iOS announcement and the instructions for how to set up your environment to enable Visual Studio to deploy, build, and debug to iOS.
The Visual Studio 2015 RC debugging experience includes (but is not limited to): F5, Output window, Breakpoints, Step Into/Over/Out, Run To Cursor, Call Stack, Data and Variable windows, Modules window, Address level debugging (Disassembly, Memory, Registers windows), Threads window, and Parallel Stacks and Parallel Watch windows.
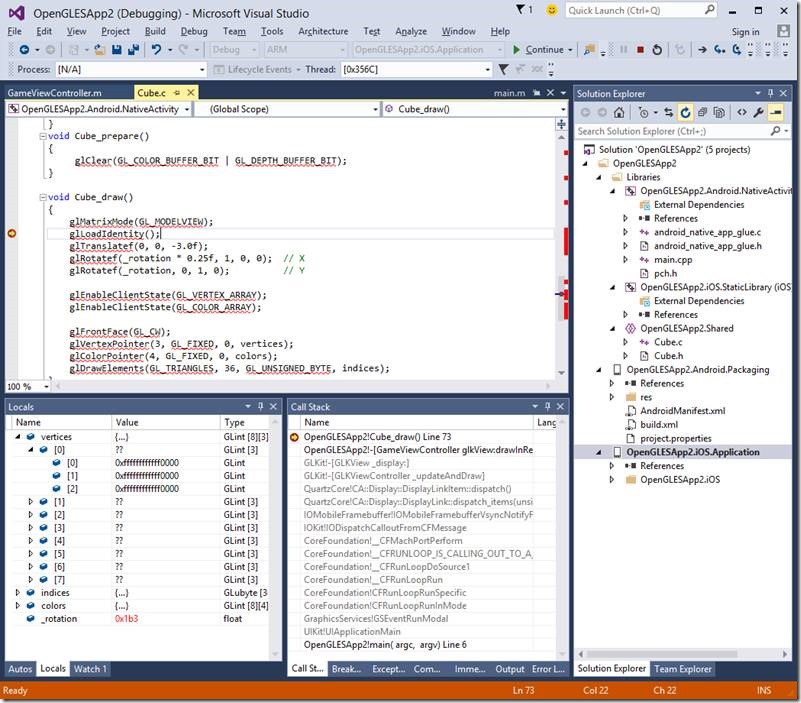
Below is a screenshot showing Visual Studio stopped at a breakpoint in C++ code for an iOS app.
In Visual Studio 2015 RC debugging using the iOS Simulator rather than a physical device will requiring the following manual steps:
- You must manually start the iOS simulator
- Then start debugging from Visual Studio (F5) once the Simulator is running
- Manually launch the app on the Simulator, Visual Studio will then attach and start the debugging the app
Additionally the following debugger functionality is not supported:
- Diagnostic Tools window
- Changing exception settings in the Exceptions window
- Hexadecimal display of integers
- Breakpoint binding to multiple locations (e.g. templates, files with the exact same name)
- Show parameter values in the Call Stack window
- Attach to process
- Autos window
- Return values
- Just My Code
- Edit and Continue
- Tasks window (including Tasks view in the Parallel Stacks window)
- Interop debugging with other runtimes (e.g. Xamarin)
Please try debugging Visual Studio’s new debugging support for C++ on iOS and let us know if you find any issues not already listed above.
Lastly, please let us know how the debugging support works for you, and report any issues or overall feedback below, through the Send a Smile feature in Visual Studio, or in our MSDN forum.


 Light
Light Dark
Dark
0 comments