

The VS CMake team has been working in close collaboration with Kitware on developing a debugger for CMake scripts in the Visual Studio IDE (see this open Kitware issue for more details). We will be contributing this work back upstream (targeting the 3.27 release) so that the developer community can have it and work to improve it together, by adding new features and support for additional DAP capabilities.
We are excited to announce that a preview of the CMake debugger is now available to debug your CMake scripts and CMakeLists.txt file for any CMake project in Visual Studio 17.6 Preview 1.
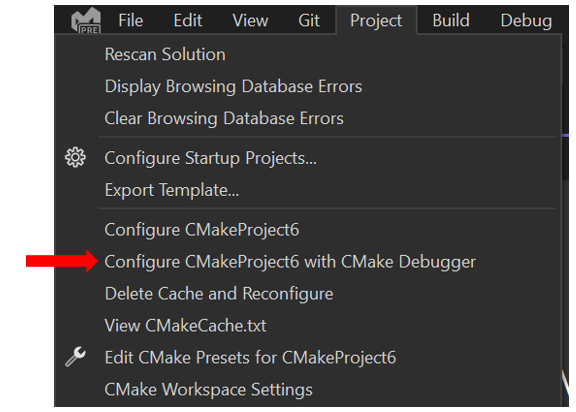
To initiate a CMake debugging session, you can select “Configure [Project Name] with CMake Debugger” from the context menu when right-clicking on your CMakeLists.txt file in the Solution Explorer or from the “Project” dropdown menu.
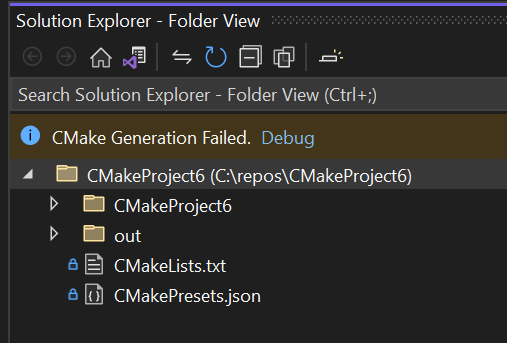
When CMake cache generation on your project fails, a “Debug” link will also be available to start a CMake debugger session in the Solution Explorer.
CMake Debugger Functionality
You can set breakpoints based on file names, line numbers, or when CMake errors and warnings are triggered in your CMakeLists.txt file by clicking in the margin to the left of the line numbers like normally or by using the Breakpoint and Exception Settings. Using these breakpoints, you can step into, over, and out of them, as well as pause or continue the executing scope like a normal debugger. 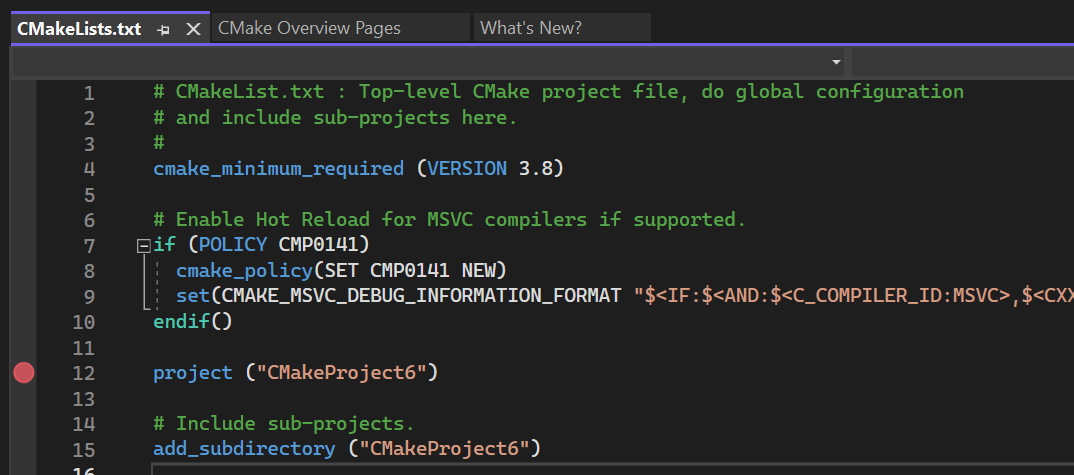

As you can see above, you can use the call stack in the CMake debugger to see filenames and lines associated with your debugging process. You can also decide which types of errors and warnings you’d like the debugger you automatically break on.
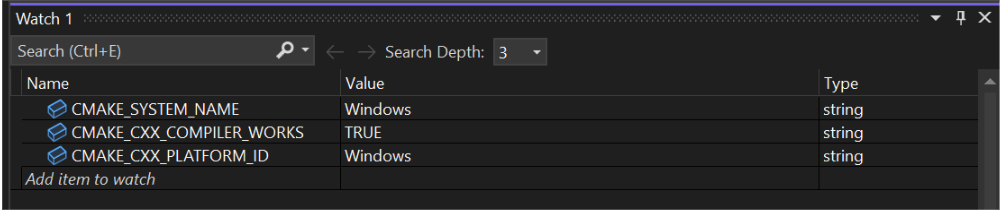
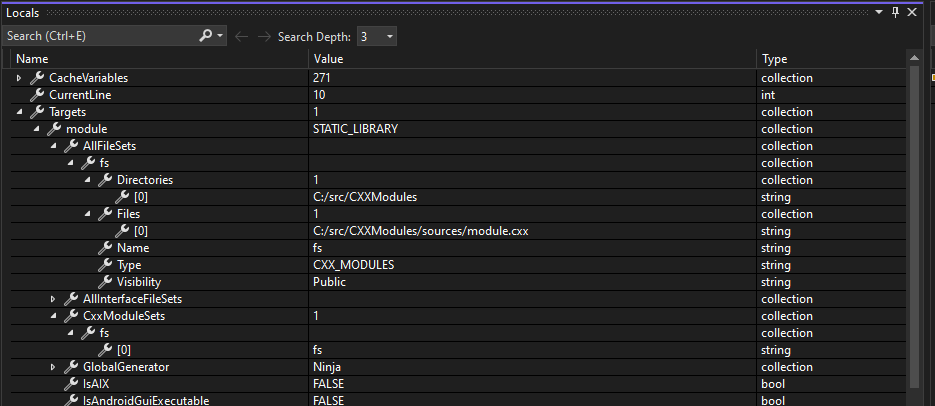
You can view the state of different CMake Cache variables through the Locals window. Then, you can set a watch on defined variables by right-clicking on them or through the Watch window. For now, this excludes function or macro arguments.
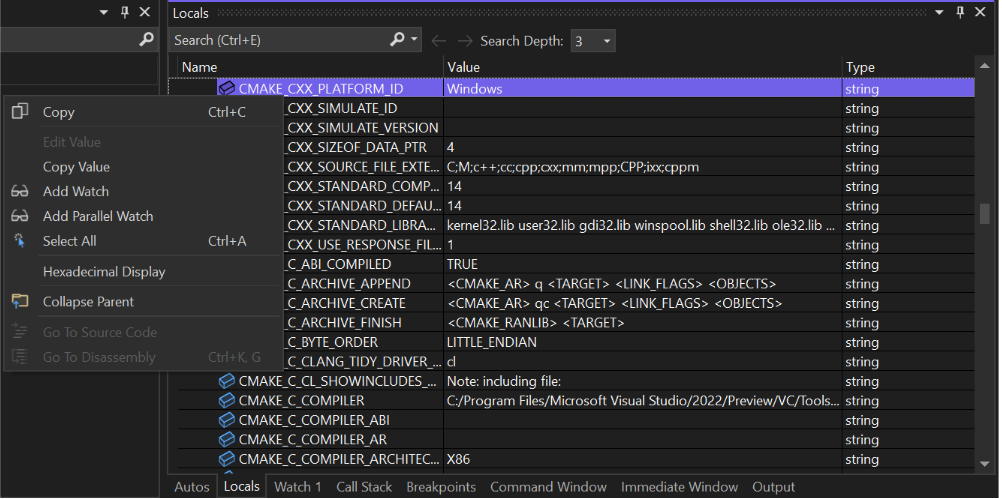
Additionally, through the Locals window, you can view the state of currently defined targets and tests with their properties.
Limitations
Currently, the CMake debugger only works with the version of CMake bundled with Visual Studio. Projects targeting WSL or remote machines are also not supported yet. When our debugger work goes into upstream CMake, we will make this feature available to both WSL and remote machines.
Future Work
We are working to add functionality to:
- Set breakpoints when variable values are read or written
- View the state of currently defined targets, directories, and tests with their properties
- Add general improvements to the debugger experience
If there’s anything else you’d like to see, please add to the suggestion ticket here.
Send us your feedback!
We hope this helps your CMake workflows in Visual Studio. Download the latest preview version of Visual Studio and give it a try. Let us know your thoughts and whether there is anything you’d like to see added. We are actively improving this feature and are very interested in your feedback. The comments below are open, or you can find us on Twitter (@VisualC) or via email at visualcpp@microsoft.com. To open a bug, please see Visual Studio Feedback.
Thank you very much. I was really looking forward to this. It makes the work much more efficient. Thanks a lot.
A dream come true! Magic to make this work!
Thank you!
Any plan to be able to profile CMake scripts ? On large projects the initial cmake configure step tends to be very slow, specially on Windows.
Profiling and seeing the results in WPA would be awesome, as we already can do for the build step itself, with vcperf.exe.
I believe that try_compile step is slow on Windows. I don’t think we can do much about it, other than trying to avoid it when possible. Compiler guys should be able to do something about it? But knowing what are the slow parts would help somewhat.
Thank God!